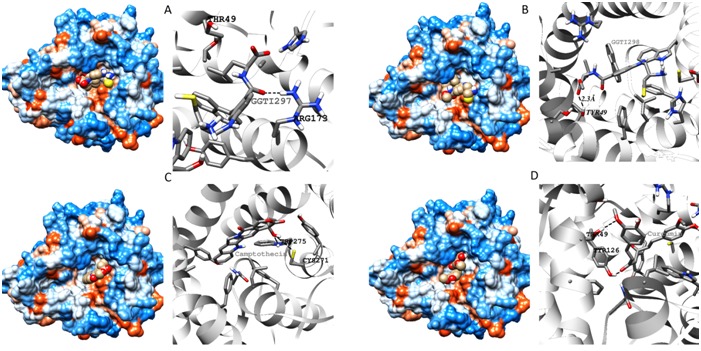
Figure 2.

Docking simulation diagrams of GGTase1 with A. GGTI297 B. GGTI298 C. Camptothecin and D. Curcumin. Docking simulations using Autodock yielded structures which were saved as PDB files and later imaged using Chimera v1.8. Protein surfaces with ligand spheres are shown in left. In right side ribbon structures with hydrogen bonds (dashed lines) and bond length are shown.
