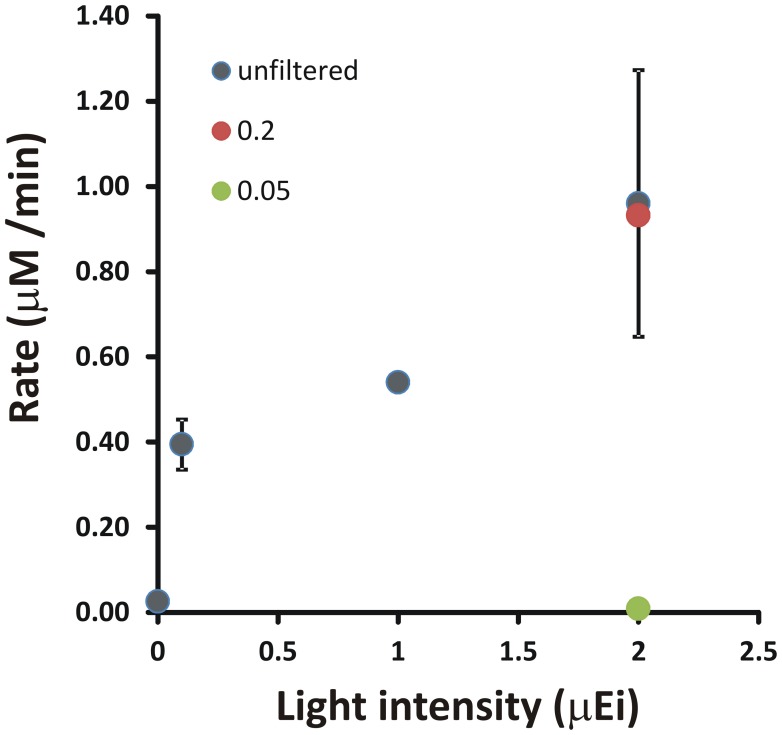
Figure 2.
A demonstration of light-stimulated sulfide oxidation in a shipboard incubation experiment with Chesapeake Bay waters. Light intensity indicates the measured incident PAR for the incubation experiment. Rates were determined by linear regression of [HS−] vs. time for incubations under each condition. Error bars are the standard deviation of rates calculated from at least two independent incubations.

