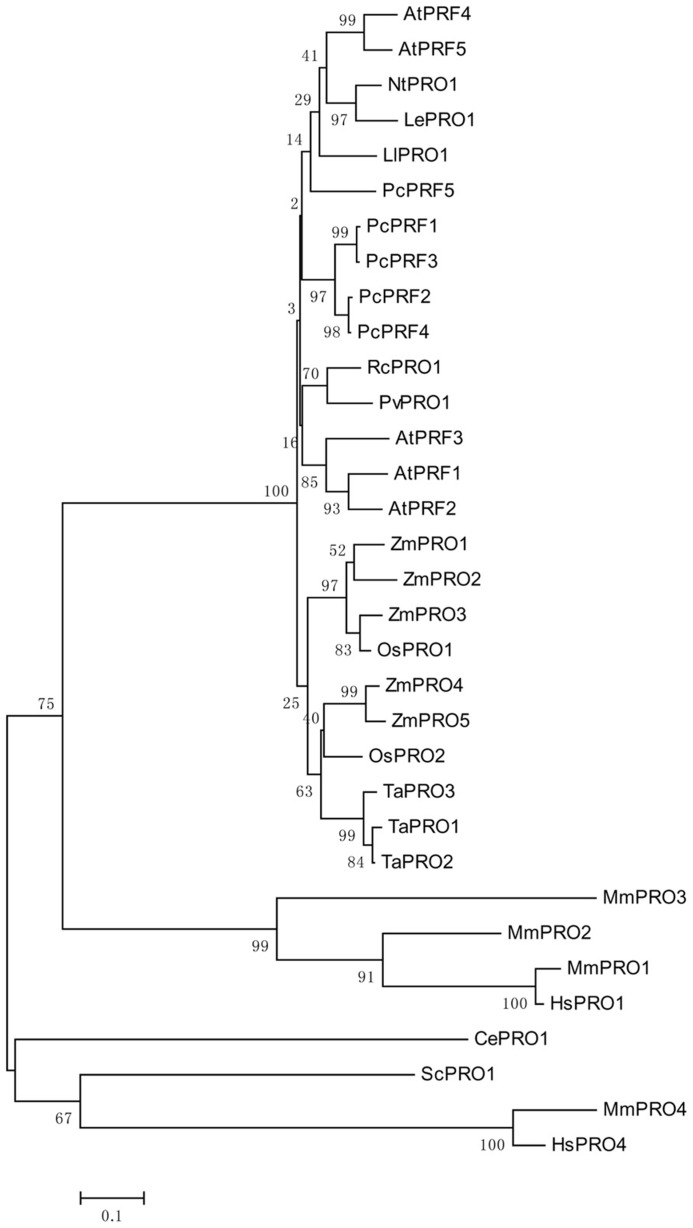
FIGURE 1.
An unrooted phylogenetic tree of profilins. The plant genes are Arabidopsis thaliana AtPRF1–AtPRF5 (AT2G19760, AT4G29350, AT5G56600, AT4G29340, AT2G19770), Petroselinum crispum PcPRF1–PcPRF5 (AY900012-AY900016), Zea mays ZmPRO1–ZmPRO5 (X73279, X73280, X73281, AF032370, AF201459), Oryza sativa OsPRO1–OsPRO2 (LOC_Os10g17680, LOC_Os06g05880), Triticum aestivum TaPRO1–TaPRO3 (X89825-X89827), Nicotiana tabacum NtPRO1 (pronp1 AJ130969), tomato LePRO1 (U50195), Ricinus communis RcPRO1 (AF092547), Phaseolus vulgaris PvPRO1 (CAA57508), Lilium longiflorum LlPRO1 (AF200184). Selected fungal and metazoan sequences are included: Mus musculus MmPRO1–MmPRO4 (NP_035202, NP_062283, NP_083579, AK013595), Homo sapiens HsPRO1 and HsPRO4 (BC057828, BC029523), Caenorhabditis elegans CePRO1 (PFN-1, NP_493258) Saccharomyces cerevisiae ScPRO1 (PFY1, NP_014765). The percentage of replicate trees in which the associated taxa clustered together in the bootstrap test (1000 replicates) is shown next to the branches (Felsenstein, 1985). The tree is drawn to scale, with branch lengths in the same units as those of the evolutionary distances used to infer the phylogenetic tree.

