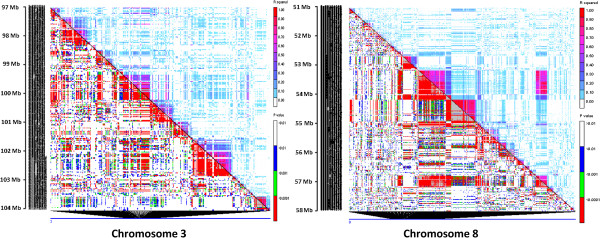
Figure 2.

Heatmaps representing variation in LD on chromosomes 3 and 8. The markers were aligned on the x and y axes according to their chromosomal positions. The squared correlation coefficient (r2) values are denoted by a color scale from white (0.0) to dark red (1.0) in the upper triangle. The p values ranging from non-significant (> 0.01; white) to highly significant (< 0.0001; red) are shown in the lower triangle. The high LD regions occurred between 94.6 and 95.1 Mb on chromosome 3, and 48.7 and 51.7 Mb on chromosome 8.
