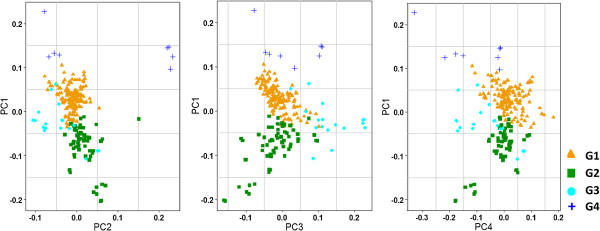
Figure 5.

Principal components explained the distribution pattern of the genotypes. All genotypes in the PCA plot were color coded as per the ADMIXTURE groupings and showed similar grouping patterns except for the minor groups. Some of the genotypes from the two minor clusters from ADMIXTURE were mixed with the major groups.
