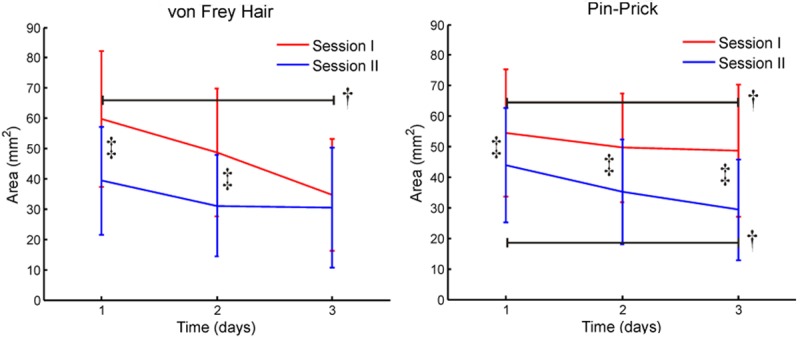
Figure 5.

The area of secondary hyperalgesia in the UVB model. The area of secondary hyperalgesia after UVB treatment was assessed as sensory changes when stimulated by von Fray filaments and weight calibrated pin prick stimulation. Difference between sessions is indicated by ‡, and a black line spans differences within post UVB treatment assessments is indicated by †.
