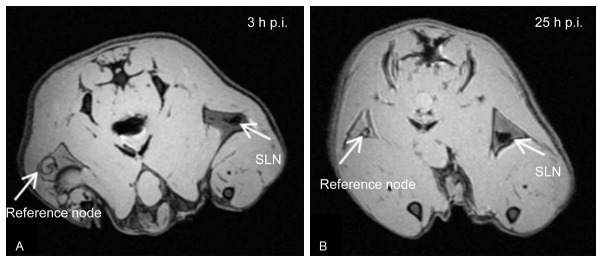
Figure 3.

MR imaging of rats visualizing the SLN. A: Axial MR image of the same animal as shown in Figure 2. The uptake of the 68Ga-SPIONs in SLN after 3 h is evidently seen in the image. B: The SLN are clearly visualized indicating hypointensity due to accumulation of the 68Ga-SPIONs, 25 h after injection.
