Figure 4.

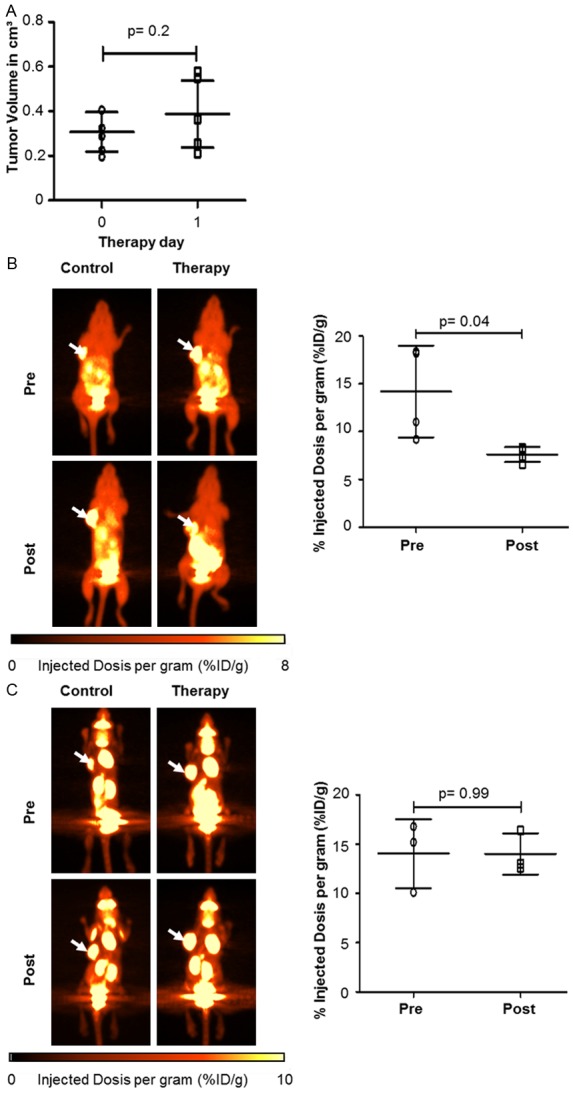
Functional in vivo imaging of A673 inhibition with [18F]FLT-PET is superior to [18F]FDG-PET. Mice were treated with Sorafenib (n=7, 30 mg/kg i.p. daily) or PBS solution (n=7, i.p. daily) when xenotransplants reached a volume of approximately 100 mm3 (day 0). (A) Tumor volume did not change after 24 h Sorafenib treatment in therapeutic group (p=0.2). [18F]FLT- (B) and [18F]FDG-PET (C) was performed before (day 0) and 24 h after initiation of therapy. Left panels: representative PET scans showing change of tumor tracer uptake (arrows). Right panels: tracer uptake, before and after treatment, was calculated. Mean %ID/g of [18F]FLT-PET (p=0.04) was significantly reduced in contrast to %ID/g of [18F]FDG-PET (p=0.99).
