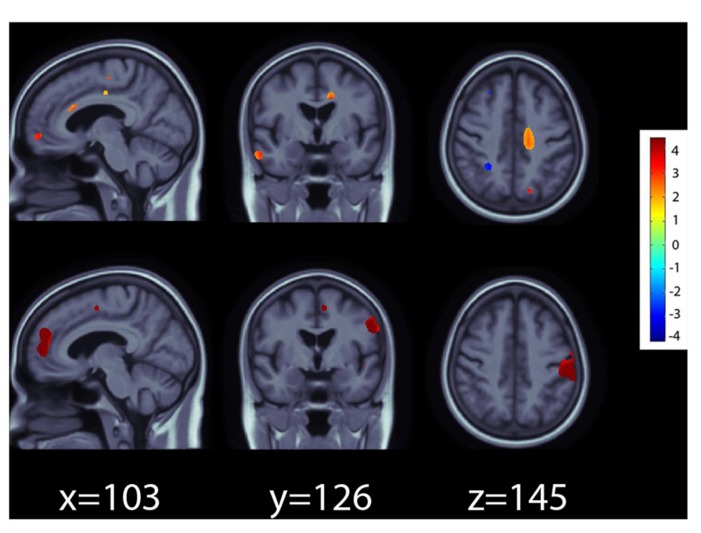
FIGURE 1.
Effects of the A allele at the rs26907 locus in the RASGRF2 gene, on regional brain volumes in the ADNI1 (top panel) and ADNI2 (bottom panel) cohorts. Positive beta values (warm colors) show regions where the minor A allele was associated with greater tissue volumes. Negative beta values (cool colors) show regions where the minor A allele was associated with lower tissue volumes. The color bar encodes the average percentage of volume difference relative to the template associated with the minor allele. Tests for associations are adjusted for age, sex, and diagnosis; maps are corrected for multiple comparisons with the searchlight false discovery rate (FDR) method at q = 0.05. Images are in radiological convention (left side of the brain shown on the right).

