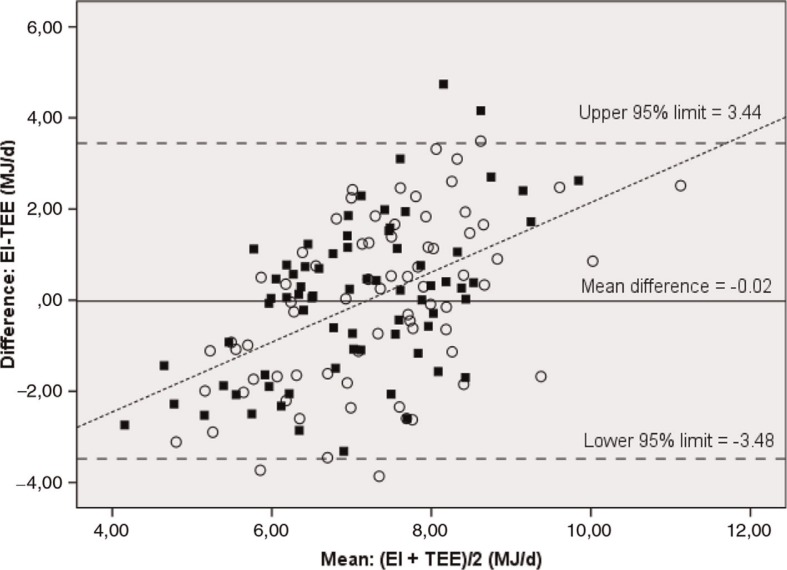
Fig. 4.
Bland–Altman plot for repeated measures of the differences between energy intake (EI) derived from the WebDASC* and accelerometer-determined energy expenditure (TEE) plotted against the mean of EI and TEE (n=72) (31). ■=baseline and ○=intervention.
*Web-based Dietary Assessment Software for Children.

