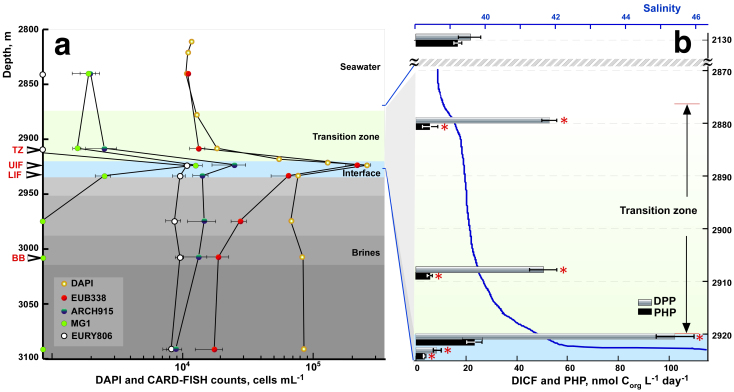
Figure 2. Depth profiles of microbiological abundance and productivity through the Lake Medee.
Cell counts using DAPI and CARD-FISH (a) and heterotrophic (PHP) and DIC fixation activity (b). Data points are mean ± standard error (n = 3). Significant differences (p < 0.05) denoted with asterisks. Layers sampled for molecular analyses indicated by arrows. Abbreviations used: TZ, transition zone; UIF, upper interface; LIF, lower interface; BB, body brine; EUB, Eubacteria; ARCH, Archaea, MG I, Marine Group I of the Thaumarchaeota; EURY, Euryarchaeota.

