
Figure 4. The TGFβ-responsive signature distinguishes a subset of dSSc patients.
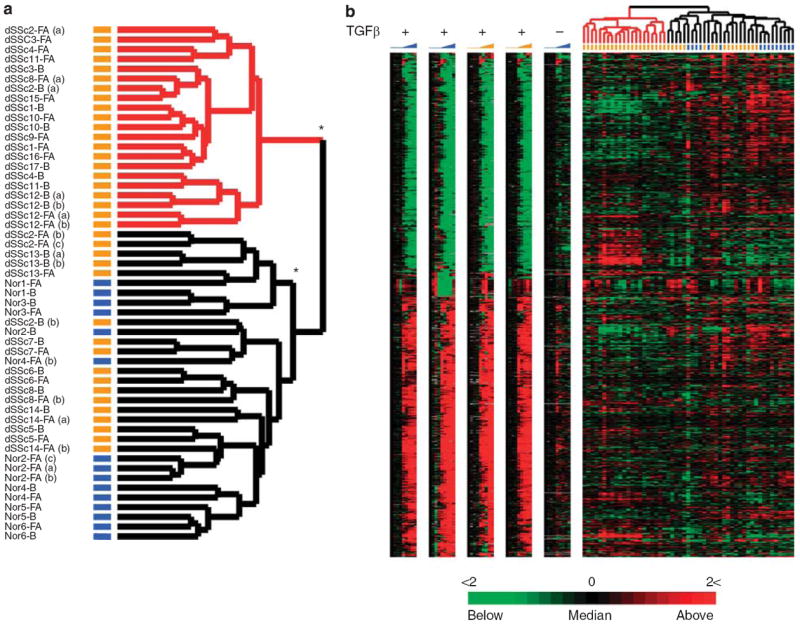
(a) Patient sample dendrogram resulting from hierarchical clustering of 53 arrays probing gene expression in skin biopsies of patients with dSSc (orange bars) and healthy control (blue bars). The samples were clustered using the 894 TGFβ-responsive probes that comprise the signature. Two major groups of samples are evident: TGFβ-activated (red) and TGFβ-not-activated (black). Technical replicates are designated by a letter (a, b or c) following patient and biopsy site identification. Statistically significant clusters as determined by SigClust are marked by *(P < 0.001). (b) Individual TGFβ time courses are aligned with the gene expression data from dSSc and healthy control biopsies, and illustrate the heterogeneity of the in vitro–derived TGFβ-responsive signature in skin biopsies.