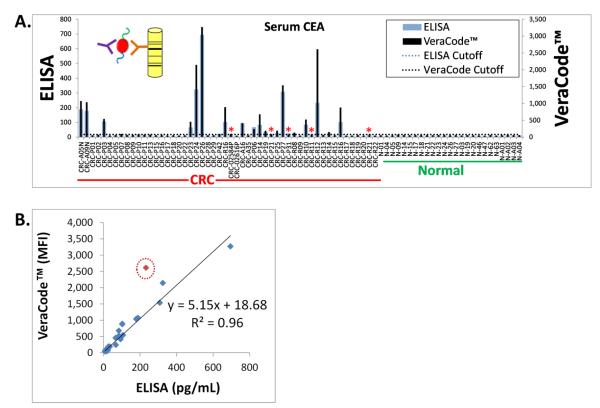
Figure 3. Concordance of ELISA and VeraCode™ for Detection of Circulating Protein Markers Such as CEA in CRC.
(A.) Results from ELISA (blue bars) were compared to results obtained from VeraCode™ beads (black bars). Both assays were formatted as a sandwich immunoassay whereby serum/plasma CEA protein was bound to the ELISA plate or bead surface by a monoclonal anti-CEA capture antibody, followed by detection using a labeled anti-CEA antibody targeting a different epitope than the capture antibody, as depicted in the inset diagram for the VeraCode™ beads. MFI= Mean Fluorescence Intensity of the BeadXpress™ instrument readout. Individual patient samples are denoted on the x-axis whereby the prefix CRC = Colorectal Cancer and N = Normal (Healthy Individuals). The overall CRC and normal patient cohorts are also labeled below the x-axis. The black dotted and blue horizontal lines on the graph indicate the diagnostic scoring cutoffs for each assay (based on log2 data). The red asterisks represent the only discordant hits, which were borderline positive or negative CRC samples that fell extremely close to the cutoffs. (B.) Linear regression analysis comparing VeraCode™ bead results, plotted on the y-axis in MFI, with ELISA results, plotted on the x-axis in pg/mL. The R2 value is 0.96 excluding one outlier (0.90 if the outlier, noted by the red circle, is included).

