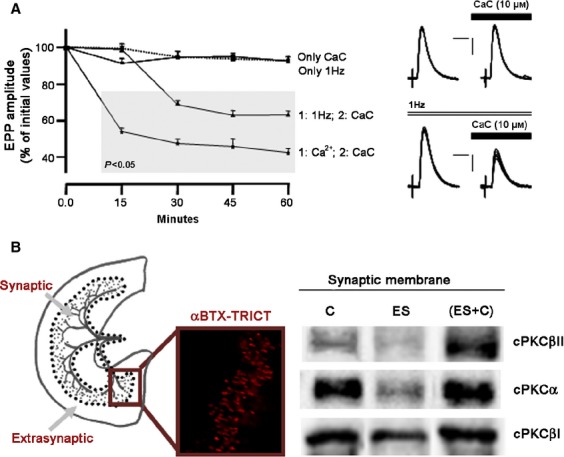
Fig. 2.

Effect of electrical stimulation and electrical stimulation -induced contraction on nPKCε, cPKCα and cPKC βI. (A) Time course of CaC effect on EPP amplitude when incubated solely (only CaC, 10 μm; dotted line) to the muscle, when a continuous stimulation at 1 Hz was applied previously (1 h) during the CaC incubation (1 : 1 Hz; 2 : CaC) and in the presence of high external calcium (1 : Ca2+; 2 : CaC). We can see also the EPP amplitude when continuous stimulation at 1 Hz was applied (only 1 Hz). Values are expressed as percentages (mean ± SE) with respect to initial amplitude. n = 10–15 single fibers by the kind of experiment. Points into the grey area: P < 0.05 with respect to initial values (0.0 min). On the right, raw data showing examples of the CaC effect on synaptic potentials with and without electrical stimulation. EPPs were recorded before and at 60 min of CaC application. Up: only CaC. Down: CaC with continuous stimulation at 1 Hz. Note that the following changes can be seen only in down: the EPP sizes were diminished and the EPP variances increased. Artefacts are modified for clarity. Scale bars: horizontal: 4 ms, vertical: 3 mV. (B) Drawing of the diaphragm muscle showing the innervated area of the muscle. Dotted lines indicate the place at which synaptic and extrasynaptic zones were separated. The fluorescent image shows the NMJs detected with TRITC-conjugated α-BTX. Note that NMJs are located at the synaptic area and no NMJs were detected in the extrasynaptic area. Western blotting analysis of cPKCα, βI, βII isoform immunoreactivity levels in diaphragm muscles from synaptic membranes under basal conditions (Control) and after electrical stimulation (1 Hz, 30 min) with (ES + C) and without (ES) muscle contraction. Experimental conditions resulted in a significant change (P < 0.05) from control values. Reproduced with permission from Besalduch et al. (2010).
