Figure 2.

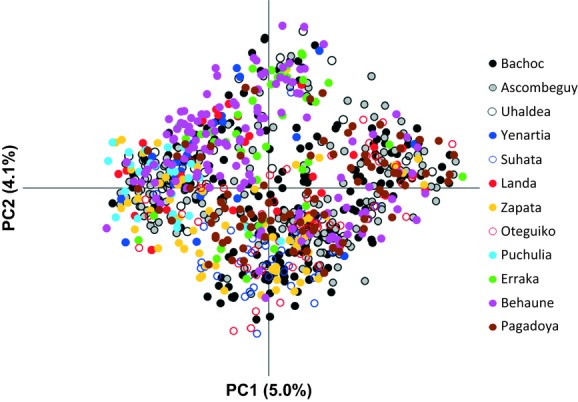
Plot of the first two component axes (PC1 and PC2) and the variance explained based on microsatellite genotypes of house sparrows (Passer domesticus) from the 12 locations in Lantabat, southern France.

Plot of the first two component axes (PC1 and PC2) and the variance explained based on microsatellite genotypes of house sparrows (Passer domesticus) from the 12 locations in Lantabat, southern France.