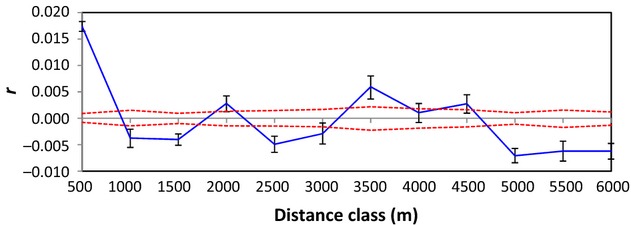
Figure 3.

Correlograms of spatial autocorrelation plots based on 10 loci of 891 house sparrows (Passer domesticus) from the 12 locations in Lantabat, southern France. Autocorrelation values (r) are represented by the solid line. The red dashed line represents the 95% confidence limits around r of zero determined by 999 r permutations of the data. Error bars represent the bootstrap 95% confidence limits around the estimates of r for each distance class.
