Fig. 1.
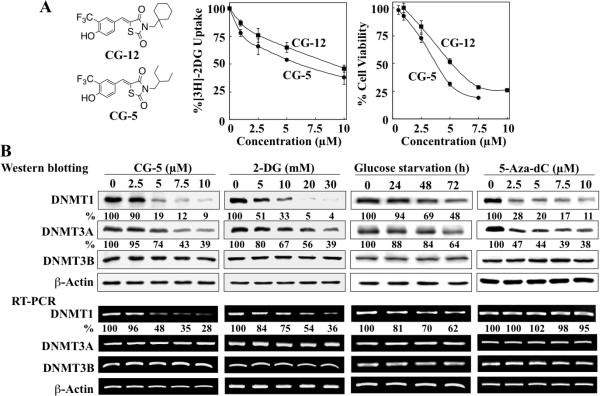
CG-5, 2-DG, glucose starvation and 5-aza-dC differentially affect the expression levels of DNMT isoforms. (A) Left, structures of CG-12 and CG-5. Center, dose-dependent inhibitory effects of CG-5 versus CG-12 on the uptake of [3H]-2DG into LNCaP cells after 30 min of treatment. Point, mean; bars, SD (n = 3). Right, dose-dependent inhibitory effects of CG-5 versus CG-12 on the viability of LNCaP cells by MTT assays after 72 h of treatment. Point, mean; bars, SD (n = 6). (B) LNCaP cells were treated with CG-5, 2-DG and 5-aza-dC at the indicated concentrations in 10% FBS-supplemented medium for 48 h or glucose-free medium for various time intervals. The expression levels of DNMT1, DNMT3A and DNMT3B were determined by Western blotting (upper) and RT-PCR (lower). The percentages denote the relative intensities of mRNA and protein bands of treated samples to those of the respective DMSO vehicle-treated controls after normalization to the respective internal reference β-actin. Each value represents the average of three independent experiments.

