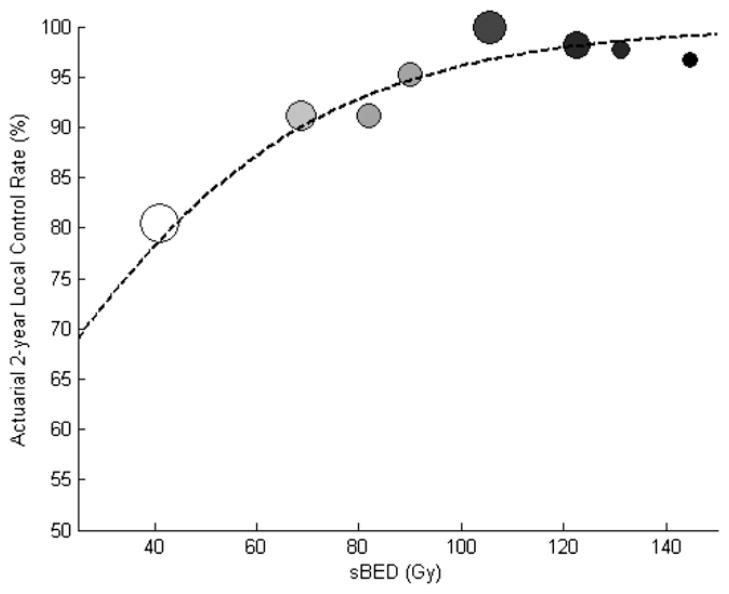
Fig. 1.
Actuarial 2-year local control vs size-adjusted biologically effective dose (sBED). Each circle represents the outcomes in 60–66 patients after sorting by sBED. sBED is defined as biologically effective dose (calculated using the linear quadratic model with α/β = 10 Gy) minus 10 times the tumor diameter in centimeters. The size of each circle is proportional to the mean tumor diameter. Darker circles indicate a higher biologically effective dose. Dotted line depicts the optimal tumor control probability model (TCD50 = 0 Gy, k = 31 Gy).

