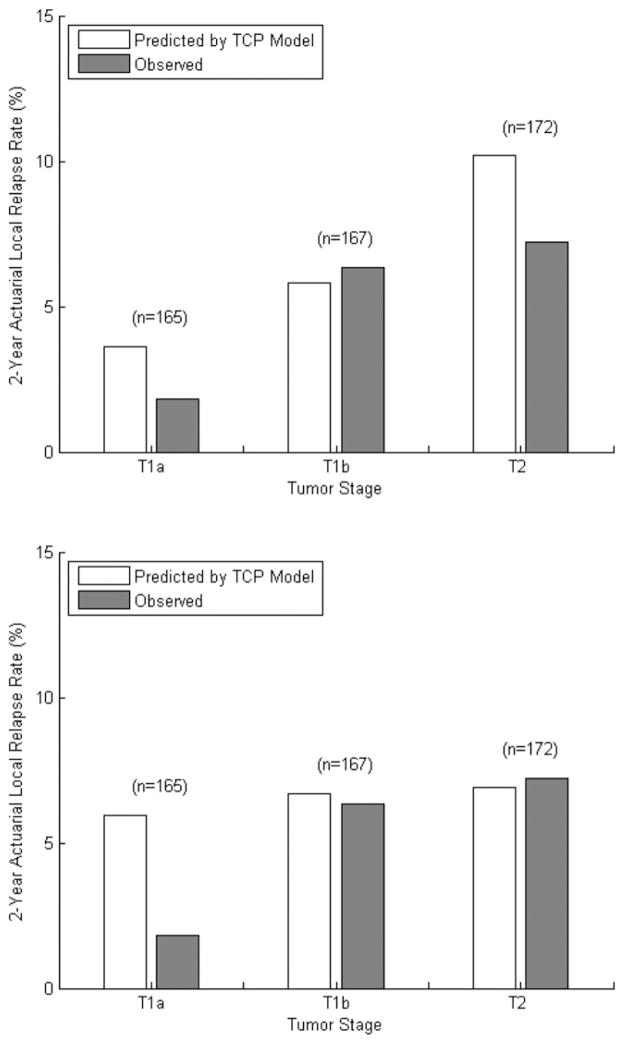
Fig. 3.
Predicted and observed 2-year actuarial local relapse rates after grouping patients by T stage, with (top) and without (bottom) inclusion of tumor size in the tumor control probability (TCP) model. With tumor size included (c = 10 Gy/cm, top), 2-tailed χ2 testing revealed no significant difference between the rates of local recurrences and those predicted by the tumor control probability (TCP) model, with P values of .211, .766, and .199 for T1a, T1b, and T2 tumors, respectively. When tumor size is excluded from the model (c = 0 Gy/cm, bottom), the optimal TCP model significantly overestimates the frequency of local relapse (P=.025) for T1a tumors.

