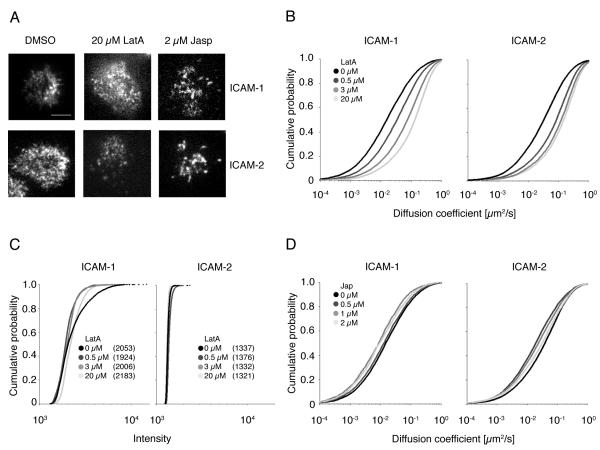
FIGURE 5.
Disruption of actin filaments increases the mobility of ICAM-1 and ICAM-2. The mobility of ICAM-1 (A, upper panel, bar indicates 5 μm, B and D, left side) and ICAM-2 (A, lower panel, B and D, right side) in 721.221 cells treated with the indicated concentrations of Latrunculin A (A, middle, B) and Jasplakinolide (A, right, D) was determined by Total Internal Reflection Fluorescence (TIRF) microscopy. The movement of ICAM particles labeled with ICAM-1 and ICAM-2 PE-conjugated antibodies was tracked by capturing TIRF images at 32 frames per second for 250 frames. Diffusion coefficients of ICAM-1 (B, and D, left side) or ICAM-2 (B and D, right side) particles are shown in CDF plots. Plots represent one representative experiment out of 2. The total number of ICAM-1 particles analyzed over the drug concentration range is ~40,500 for Latrunculin treated cells and ~15,400 for Jasplakinolide treated cells. The p-values for the Latrunculin treated cells are the following: p = 4.98 × 10−95 between DMSO and 0.5 μM LatA, p = 7.81 × 10−141 between 0.5 μM LatA and 3 μM LatA, and p = 7.86 × 10−116 between 3 μM and 20 μM LatA. All determined by Kolmogorov-Smirnov test. Similarly, ~32,700 ICAM-2 particles in Latrunculin treated cells and ~23,600 particles in Jasplakinolide treated cells were analyzed. C, The average intensity of ICAM-1 and ICAM-2 particles was measured in a 5×5 pixel grid centered over the peak of the Gaussian distribution calculated for the particle in the first frame in which it appeared in the tracking algorithm. Average particle intensities are shown in CDF plots. Median intensities are indicated in parenthesis.

