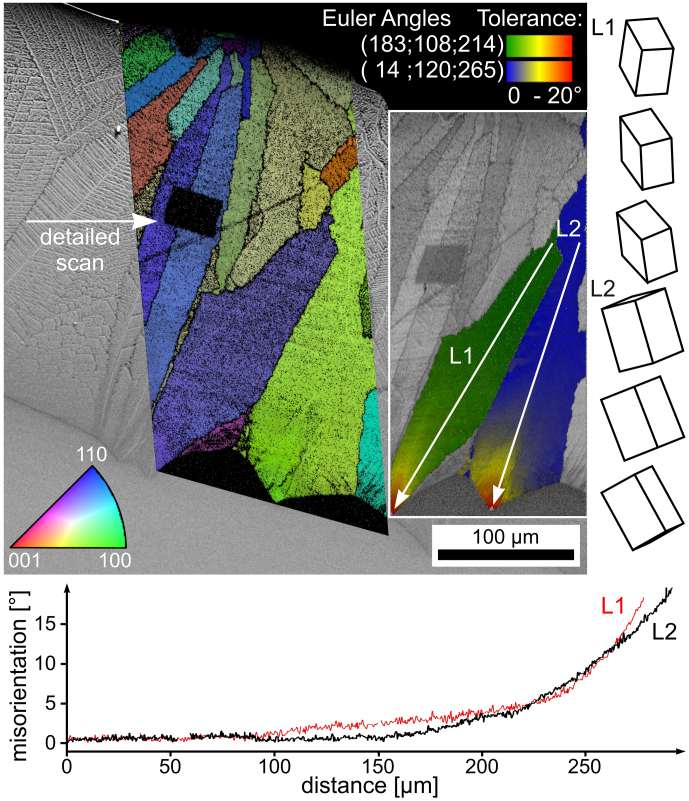
Figure 6. SEM-micrograph of the cross section of a quenched sample superimposed by the IPF + IQ-map of an EBSD-scan.
An orientation + IQ-map of the same scan is presented to the right highlighting orientational changes in two specific dendrites. The point-to-origin misorientation profiles presented below indicate an increasing rate of orientation change over distance along the lines L1 and L2.

