
Figure 12.
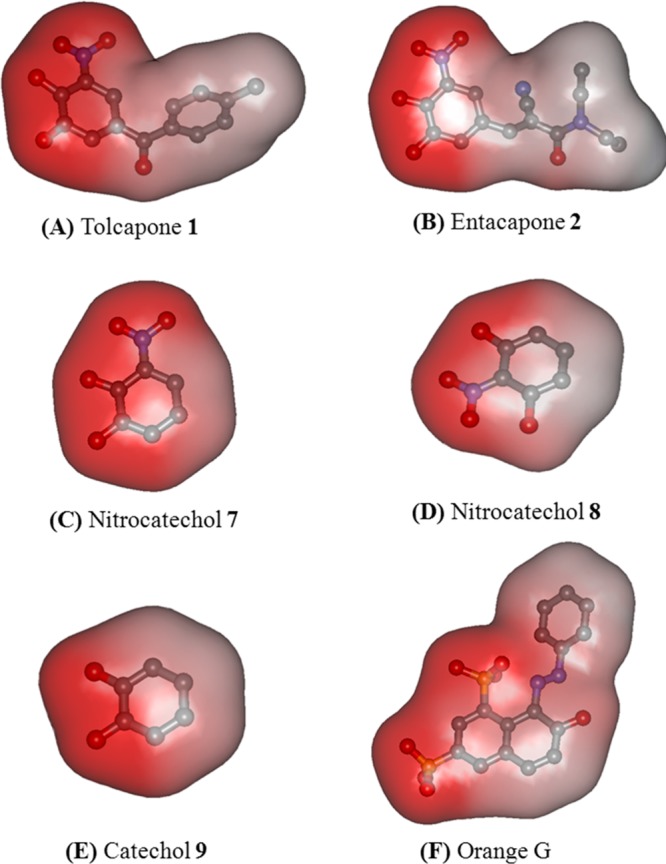
Charge density maps for (A) tolcapone 1, (B) entacapone 2, (C) nitrocatechol 7, (D) nitrocatechol 8, (E) catechol 9, and (F) Orange G. The hydrogen atoms are removed for clarity. Red color indicates polar region, and blue/gray color indicates nonpolar region in the molecule.