Figure 5.
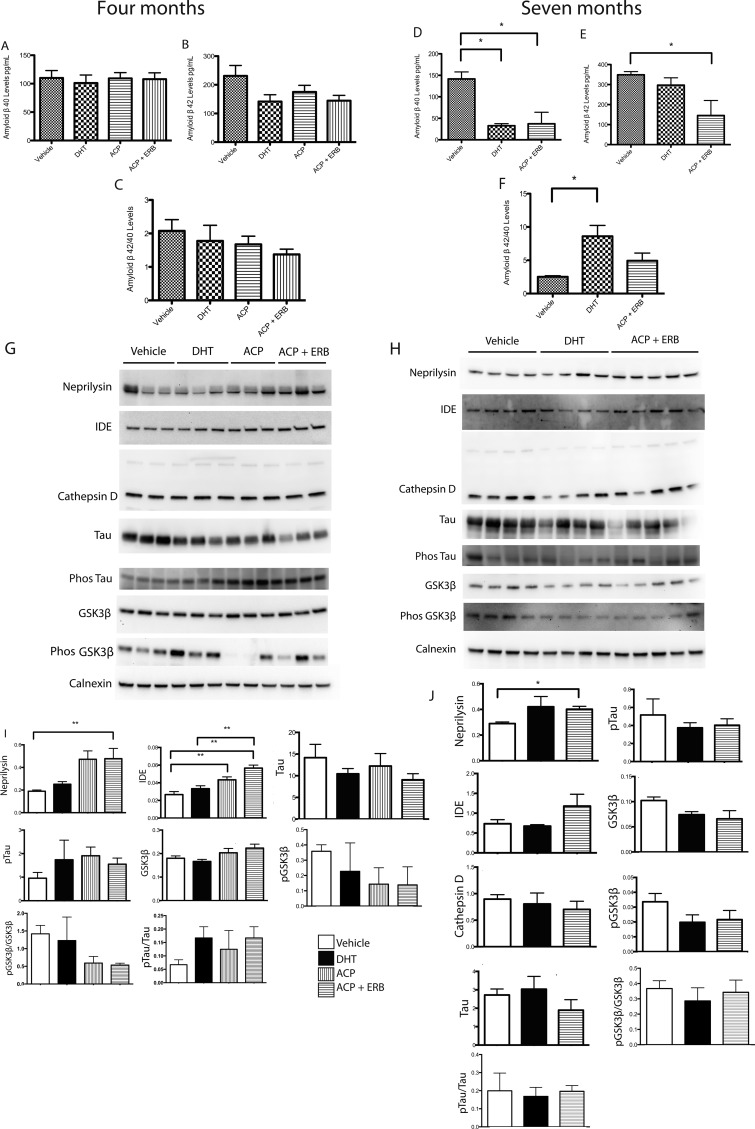
The levels of Aβ and related proteins in gonadectomized 3xTg-AD mice treated with SARMs/ERβ agonists for 4 and 7 months. (A) The levels of Aβ40 in the brain of mice treated with SARMs and ERβ agonists for 4 months. There was no significant difference between the groups (p > 0.05). (B) The levels of Aβ42 in the brain of mice treated with SARMs and ERβ agonists for 4 months. There was no significant difference between the groups (p > 0.05). (C) The ratio of Aβ42/Aβ40 in the brains of mice treated with SARMs and ERβ agonists for 4 months. There was no significant difference between the groups, although the data does indicate a trend for a decline in the levels. (D) The levels of Aβ40 in the brains of mice treated with SARMs and ERβ agonists for a period of 7 months are significantly decreased (p < 0.05). (E) The levels of Aβ42 in the brains of mice treated with SARMs and ERβ agonists for a period of 7 months are significantly decreased (p < 0.05). (F) The ratio of Aβ42/Aβ40 in the brains of mice treated with SARMs and ERβ agonists for 7 months. There was a significant difference between the groups (p < 0.05). (G) Representative Western blots from gonadectomized 3xTg-AD mice treated with SARM/ERβ agonist for 4 months compared with controls. Treated mice have increased neprilysin and insulin-degrading enzyme (IDE) levels compared with vehicle control (n = 4 or 5 per group). (H) Representative Western blots from gonadectomized 3xTg-AD mice treated with SARM/ERβ agonist for 7 months and controls. (I) Brain protein levels were quantified using analysis software. Quantification (I, J) of brain protein levels following 4 and 7 months treatment of neprilysin, IDE, tau, phos tau, GSK3β, and phosphorylated GSK3β. Calnexin is an ER marker and was utilized as a loading control as the brain homogenates were prepared in RIPA buffer. Data expressed as means ± SEM. Asterisk denotes statistical significance (**p < 0.01, *p < 0.05).

