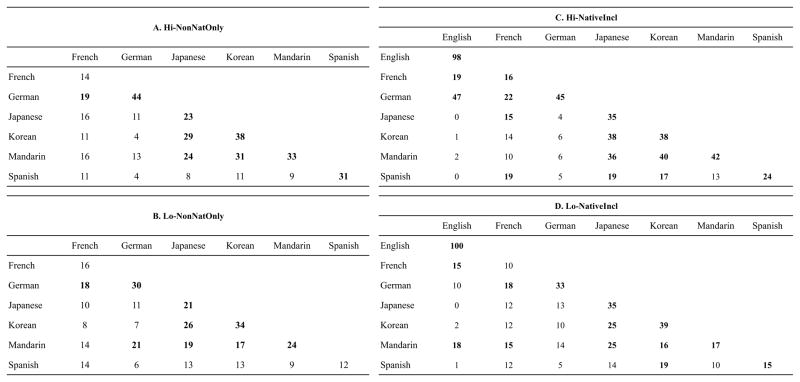
Figure 3.
Classification matrices indicating rates of correct pairings (cells on the diagonal) and of incorrect pairings (cells off of the diagonal) between each of the native language backgrounds presented to listeners in each condition. Each cell indicates the rate at which talkers with the two language backgrounds of the corresponding row and column were classified together. Each cell contains a score between 0 and 100, where 0 indicates that no talker of a given native language background was paired with any talker from the other native language background. The diagonal indicates rates of correct native language grouping (i.e., “hits”); the off-diagonal cells are the rates of incorrect pairings (i.e., “false alarms”). An off-diagonal score of 100 would indicate that all listeners grouped all four talkers from one native language background with all four talkers from the other native language background. Numbers in bold indicate native language pairings that were numerically above chance (i.e., greater than 16.7 for Hi-NonNatOnly and Lo-NonNatOnly; greater than 14.3 for Hi-NativeIncl and Lo-NativeIncl).

