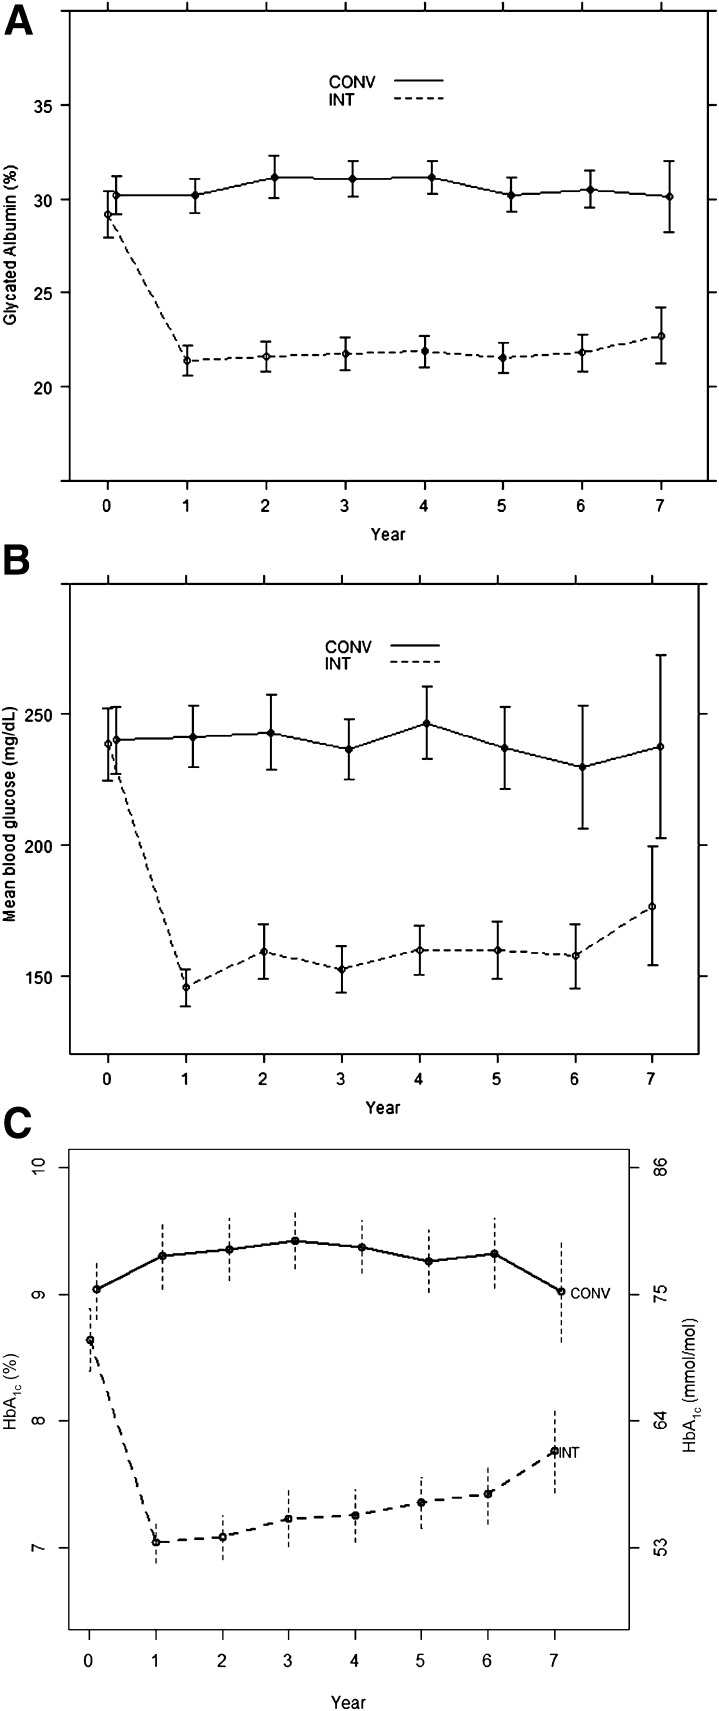
Figure 2.
Weighted estimates of the mean ± 95% CI of measures of glycemia at each annual visit during the DCCT in the aggregate cohort (N = 497) obtained from a longitudinal model with separate estimates for each group at each visit. A: GA. B: MBG. C: HbA1c. Computed as the average of the values at each visit from the 10 imputed datasets with no missing values. Sample sizes at each year of 497, 497, 496, 494, 492, 446, 332, and 214. Observations weighted by the inverse sampling probabilities within strata defined by DCCT Treatment Group, primary vs. secondary cohort, and whether a case of retinopathy, nephropathy, or CVD. CONV, conventional group; INT, intensive group.

