Table 5.
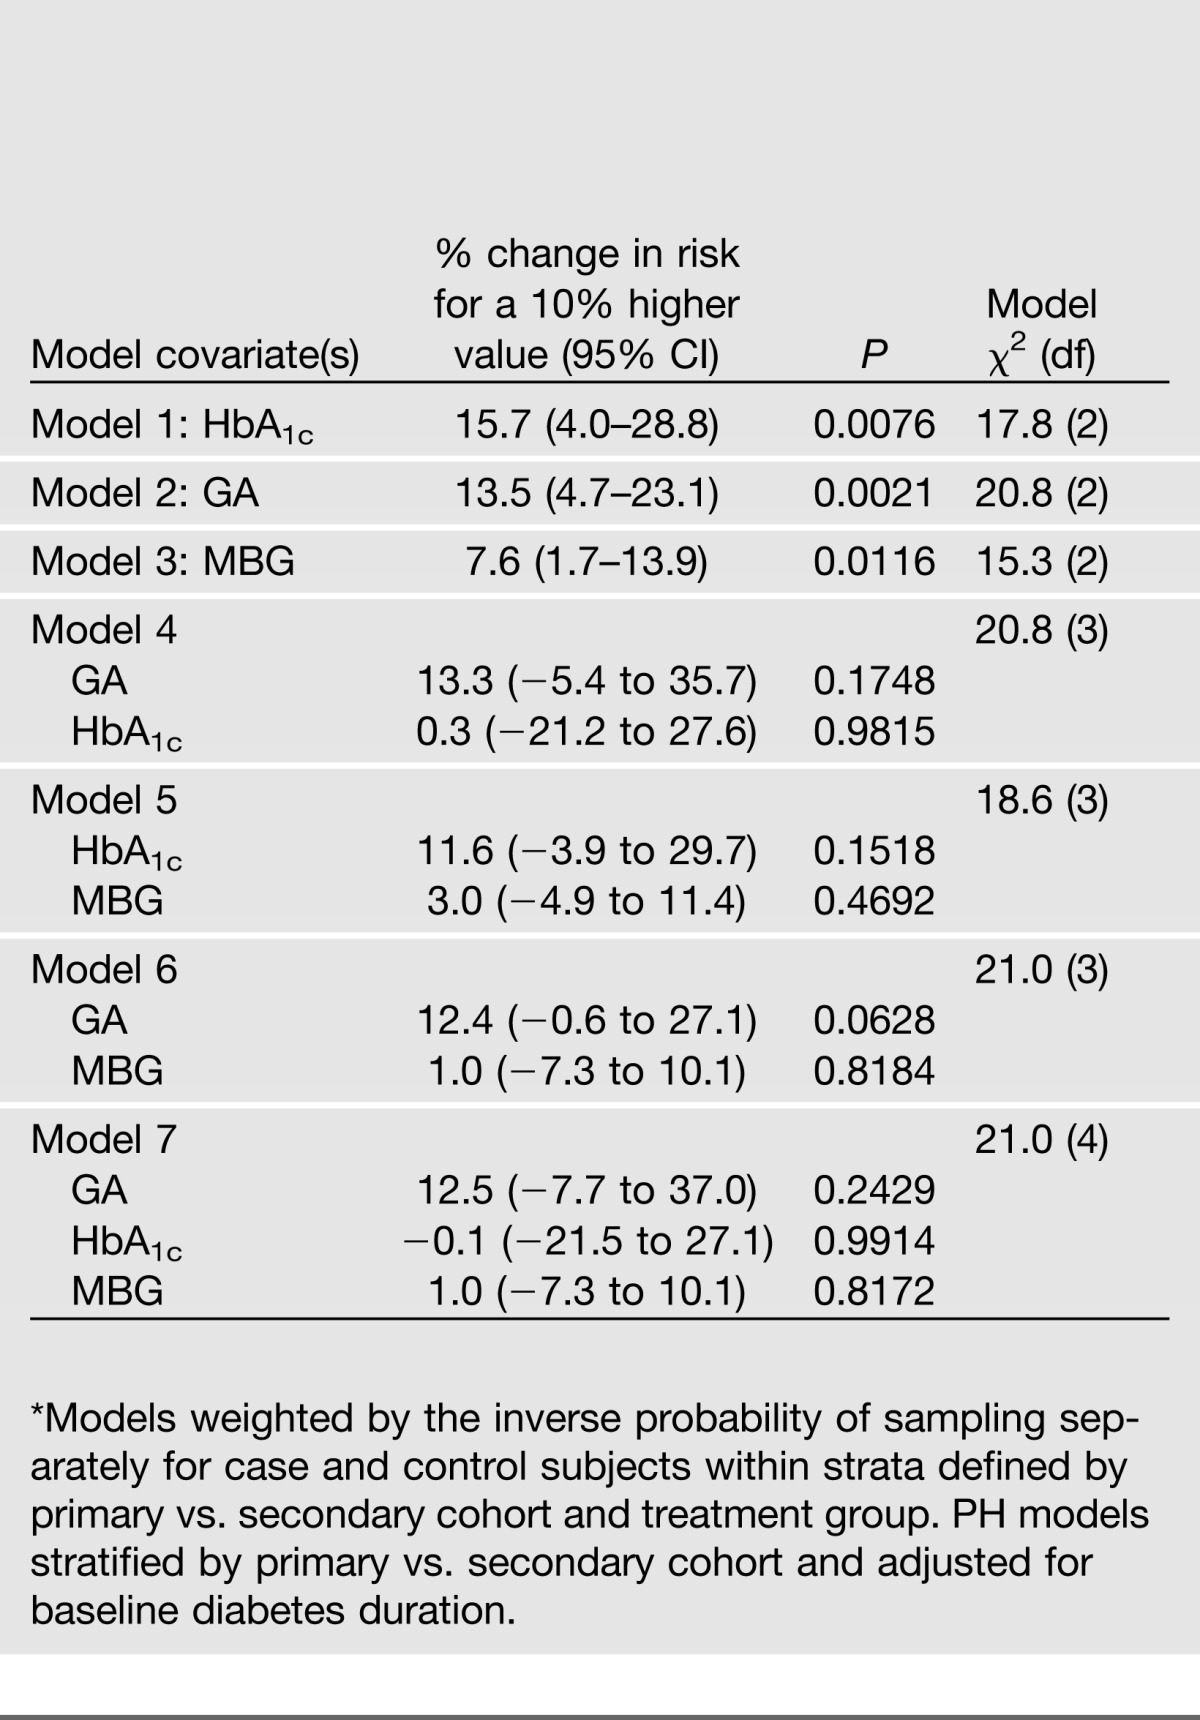
Association of measures of glycemia individually and in combination with the risk of microalbuminuria (AER ≥40 mg/24 h) or worse among 145 case vs. 184 control subjects in weighted Cox proportional hazards models*

Association of measures of glycemia individually and in combination with the risk of microalbuminuria (AER ≥40 mg/24 h) or worse among 145 case vs. 184 control subjects in weighted Cox proportional hazards models*
