
Figure 1.
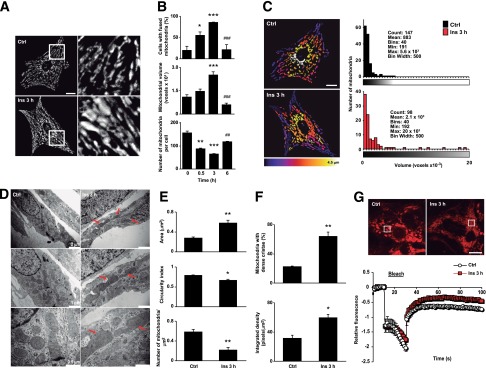
Insulin increases mitochondrial fusion in cultured cardiomyocytes. A: Time course of insulin on mitochondrial morphology. Cells were incubated with insulin (10 nmol/L) at indicated times and then loaded with MitoTracker Green. Multislice imaging reconstitution was obtained by confocal microscopy to show mitochondrial morphology. The scale bar is 10 μm. B: Percentage of cells with fused mitochondria. The individual mitochondrial volume and number of mitochondria per cell were determined. Data are mean ± SEM (n = 4). *P < 0.05, **P < 0.01, and ***P < 0.001 vs. 0 h; ##P < 0.01 and ###P < 0.001 vs. 3 h. C: Representative Z-stack reconstruction of individual mitochondrial structures and volume histograms of the representative images (n = 4). D: Representative transmission electron microscopy images from control and insulin-treated cells. Three different magnifications of the same cell are shown. Arrows indicate fused mitochondria. E and F: Mitochondrial area, circularity index, number of mitochondria per square millimeter, percentage of mitochondria with dense cristae, and cristae-integrated density were quantified from the images in D. Data are from 100 mitochondria from each control and insulin-treated cell examined from three separate experiments. Data are mean ± SEM (n = 3). *P < 0.05 and **P < 0.01 vs. control. G: FRAP analysis of the mitochondrial network (top). Bleaching of TMRM fluorescence was applied in an ∼25-μm2 square at randomly chosen regions where indicated (bleach), and fluorescence intensity was normalized to the intensity levels before and after bleaching. Data are from 15 cells examined from three separate experiments. Ctrl, control; Ins, insulin.