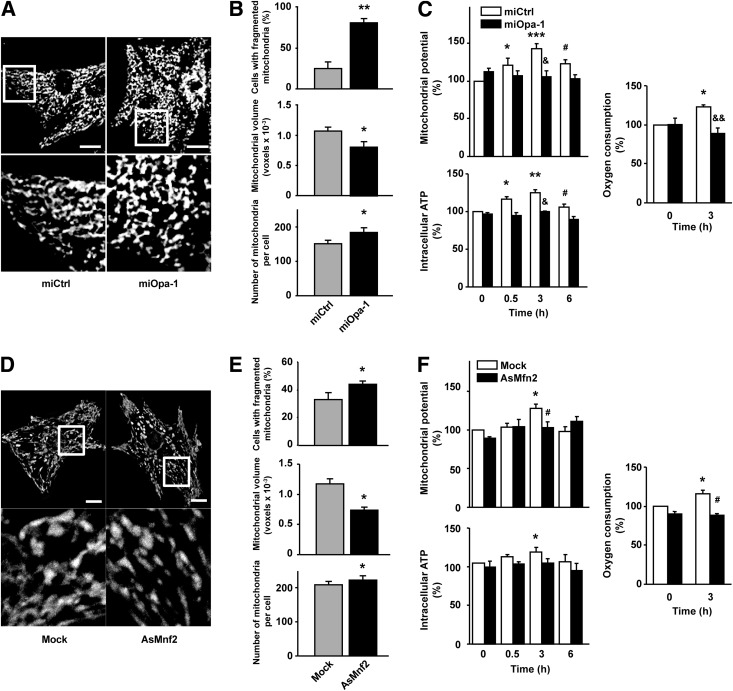
Figure 3.
Downregulation of mitochondrial fusion proteins Opa-1 and Mfn2 alters mitochondrial morphology and the metabolic response to insulin in cardiomyocytes. A: Cells were transduced for 48 h with an adenovirus encoding a scrambled microRNA (miCtrl) or a microRNA against Opa-1 (miOpa-1). Representative confocal images of cells loaded with MitoTracker Green are shown. Cells were transduced with miCtrl (MOI 1,000) or with the miOpa‑1 (MOI 1,000) for 48 h before imaging. Scale bar represents 10 μm. B: Percentage of cells with fragmented mitochondria, individual mitochondrial volume, and number of mitochondria per cell were determined for the miCtrl- and miOpa-1–treated cells. Data are mean ± SEM (n = 4). *P < 0.05 and **P < 0.01 vs. miCtrl. C: After 48 h of transduction with respective adenoviruses, the cells were exposed to insulin (10 nmol/L) for the times indicated and Ψmt, intracellular ATP content, and oxygen consumption were quantified. Data are mean ± SEM (n = 4). *P < 0.05, **P < 0.01, and ***P < 0.001 vs. miCtrl 0 h; #P < 0.05 vs. miCtrl insulin 3 h; &P < 0.05 and &&P < 0.01 vs. respective time with miCtrl. D–F: Cells were transduced for 48 h with an adenovirus coding for an AsMfn2 or an empty adenovirus (Mock) and subjected to the same analysis as miOpa-1–treated cells. Analysis of mitochondrial morphology (E) and metabolism (F) was performed as described previously in Fig. 2. Cells were transduced with AsMfn2 (MOI 1,000) or Mock (MOI 1,000) for 48 h before insulin treatment. Data are mean ± SEM (n = 4). *P < 0.05 vs. Mock 0 h, #P < 0.05 vs. Mock insulin 3 h.

