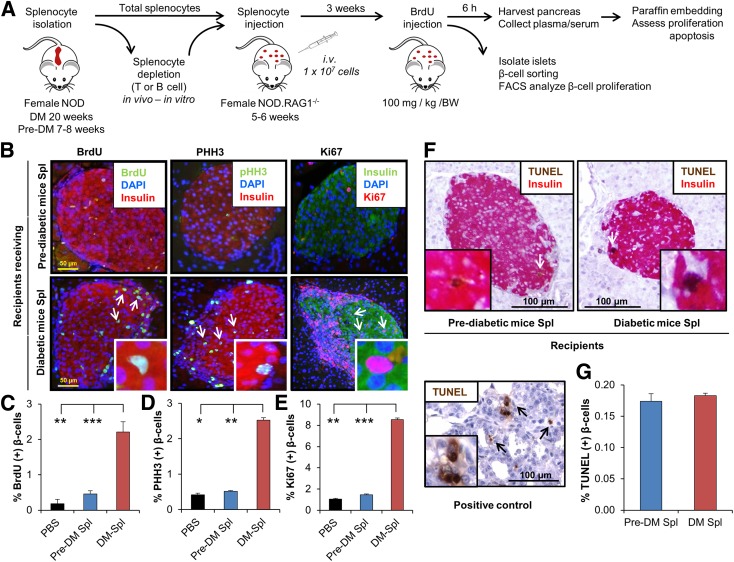
Figure 1.
Adoptive transfer of diabetes stimulates β-cell proliferation in NOD.RAG1−/− recipients. A: Experimental strategy showing total splenocyte (DM or pre-DM) or depleted splenocyte (diabetic mice) transfer (1 × 10⁷ cells) into NOD.RAG1−/− mice. BrdU (100 mg/kg/BW) was injected 3 weeks post‐transfer, and 6 h later, the pancreases were harvested for immunohistochemical analyses. B: Paraffin-embedded sections of pancreas from mice receiving DM or pre-DM splenocytes, costained with proliferation markers BrdU, pHH3, or Ki67 with insulin and DAPI. Scale bar, 50 µm. Arrows indicate proliferating β-cells (BrdU+/insulin+). Insets show magnified view of representative proliferating β-cells. Quantification of data shown in B for BrdU (C), pHH3 (D), and Ki67 (E) (n = 4–16 mice in each group). *P < 0.05; **P < 0.01; ***P < 0.001 (Student t test). F: TUNEL staining of paraffin-embedded sections of pancreatic tissues obtained from recipient mice receiving DM or pre-DM splenocytes for apoptosis detection. Scale bar, 100 µm. Arrows indicate TUNEL+/β-cell+ cells undergoing apoptosis. Inset shows a magnified representative image of TUNEL+ β-cell. Lower image represents positive control of TUNEL staining in rat tumor tissue. G: Quantification of data in F. n = 4–6 mice in each group. Data are expressed as means ± SEM. FACS, fluorescence-activated cell sorting; Spl, splenocyte.

