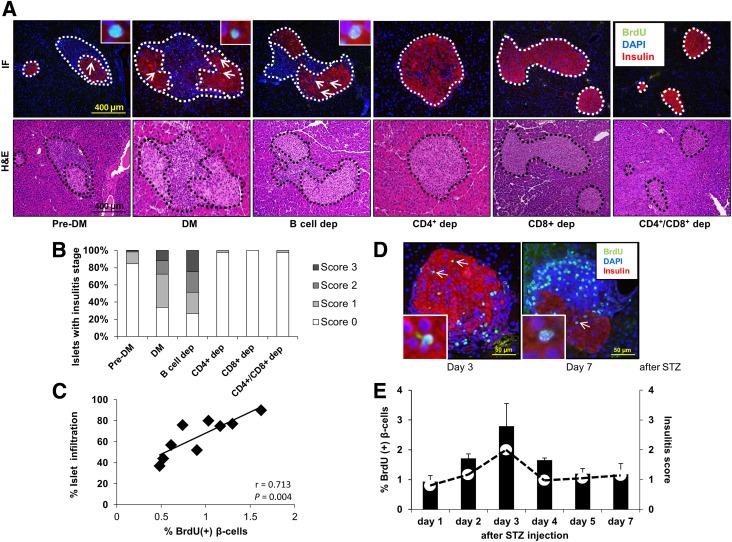
Figure 4.
Pancreatic islet infiltration positively correlates with β-cell proliferation. A: Immunofluorescence (IF) and hematoxylin and eosin (H&E) staining of consecutive pancreatic sections harvested from NOD.RAG1−/− mice 3 weeks after receiving total (DM or pre-DM) or B-cell–, CD4+-, CD8+-, and CD4+/CD8+–double-depleted diabetic NOD splenocytes. Scale bar, 400 µm. Pancreatic islets are outlined with dotted lines for ease of comprehension. B: Pancreatic islets showing insulitis expressed as a percentage in the treated groups in A. C: Linear regression of islet infiltration and BrdU+ β-cells in pancreas sections harvested from NOD.RAG1−/− mice transferred with total diabetic splenocytes. Each square represents a mouse (n = 9) scored for insulitis in at least 20 islets (n = 9). r = 0.713; P = 0.004. D: Pancreatic sections harvested from STZ-induced diabetic NOD mice at day 3 and day 7, costained for the proliferation marker BrdU (green), with insulin (red) and DAPI (blue). Scale bar, 50 µm. Arrows indicate proliferating β-cells (BrdU+/insulin+). Insets show a magnified view of a representative proliferating β-cell. E: Quantification of β-cell proliferation (bars) and insulitis scores (red dots) in the pancreatic islets in STZ-injected NOD mice at 1–7 days post-STZ administration (n = 3 mice for each time point). Data are expressed as means ± SEM. dep, depleted.

