Abstract
Most genetic variants associated with type 2 diabetes mellitus (T2DM) have been identified through genome-wide association studies (GWASs) in Europeans. The current study reports a GWAS for young-onset T2DM in American Indians. Participants were selected from a longitudinal study conducted in Pima Indians and included 278 cases with diabetes with onset before 25 years of age, 295 nondiabetic controls ≥45 years of age, and 267 siblings of cases or controls. Individuals were genotyped on a ∼1M single nucleotide polymorphism (SNP) array, resulting in 453,654 SNPs with minor allele frequency >0.05. SNPs were analyzed for association in cases and controls, and a family-based association test was conducted. Tag SNPs (n = 311) were selected for 499 SNPs associated with diabetes (P < 0.0005 in case-control analyses or P < 0.0003 in family-based analyses), and these SNPs were genotyped in up to 6,834 additional Pima Indians to assess replication. Rs1861612 in DNER was associated with T2DM (odds ratio = 1.29 per copy of the T allele; P = 6.6 × 10⁻⁸, which represents genome-wide significance accounting for the number of effectively independent SNPs analyzed). Transfection studies in murine pancreatic β-cells suggested that DNER regulates expression of notch signaling pathway genes. These studies implicate DNER as a susceptibility gene for T2DM in American Indians.
Introduction
A number of genetic variants associated with type 2 diabetes mellitus (T2DM) have been identified (1–6). Since most established susceptibility variants were detected by genome-wide association studies (GWASs) in Europeans, GWASs in non-European populations may identify other important variants. Except for our preliminary study with 80,044 markers in Pima Indians (7), there are few GWASs for T2DM in American Indians. In the current study, we extend this GWAS to include 453,654 single nucleotide polymorphisms (SNPs), and we genotype 6,834 additional individuals to identify reproducibly associated variants.
Research Design and Methods
Participants
Participants were derived from a longitudinal study conducted in the Gila River Indian Community (8). Diabetes was diagnosed by a 75 g oral glucose tolerance test according to 1997 American Diabetes Association criteria (9) or if the diagnosis was made during routine clinical care. As described previously, participants informative for analyses of young-onset diabetes or for metabolic traits related to diabetes were selected for the GWAS (10). All individuals were full-heritage American Indian, and they included 278 “cases” who developed diabetes before age 25 years (mean ± SD age of onset = 19.4 ± 4.4 years) and 295 “controls” who were nondiabetic and ≥45 years old when last examined (mean age = 55.2 ± 9.7 years). To allow for family-based analyses, discordant siblings were included. These included 129 nondiabetic siblings of cases last examined at an age older than the case’s age of onset (mean age = 28.1 ± 8.2 years) and 138 diabetic siblings of controls who developed diabetes when they were younger than the age when the control was examined (mean age at diagnosis = 40.8 ± 8.4 years). The diabetes GWAS involved 840 individuals in 514 sibships.
Replication studies were conducted in additional individuals from the longitudinal study. Initial studies (replication set 1) were conducted in 2,908 individuals (mean age = 40.0 ± 16.3 years; 43.8% with diabetes) who were not part of the GWAS and who were full-heritage Pima or who had data on metabolic traits. Selected SNPs were further typed in a second group (replication set 2) of 3,926 individuals who were largely “mixed” heritage (mean age = 27.7 ± 13.9 years; 20.2% with diabetes; mean Pima heritage = 55%). Supplementary Table 1 shows characteristics of the groups. Studies were approved by the institutional review board of the National Institute of Diabetes and Digestive and Kidney Diseases.
Association of diabetes-associated SNPs with metabolic characteristics of T2DM was assessed. Maximum BMI observed in the longitudinal study was analyzed in 6,786 individuals examined when ≥15 years of age. Fasting serum insulin concentration was measured in 5,400 of these individuals when they were nondiabetic; measures of insulin resistance (homeostasis model assessment of insulin resistance [HOMA-IR]) and β-cell function (homeostasis model assessment of β-cell function [HOMA-B]) were calculated (11). Detailed physiologic measures were made in 400 nondiabetic full-heritage Pimas. Percentage of body fat was calculated by hydrostatic weighing or dual X-ray absorptiometry, and insulin sensitivity was determined by the hyperinsulinemic–euglycemic “clamp” (12). Acute insulin response, 3–5 min after a 25 g intravenous glucose bolus, was measured in 288 normoglycemic individuals (12).
Genotyping
Genotypes in the GWAS were generated on the Affymetrix 6.0 Human SNP Array (Affymetrix, Santa Clara, CA) using the BIRDSEED algorithm, as described previously (10). SNPs were excluded if >15% of genotype calls were missing, if genotype frequencies diverged from Hardy–Weinberg expectations (P < 0.001), if concordance among 100 duplicate samples was <97%, or if minor allele frequency was <5%. Thus 453,654 SNPs were analyzed. Supplemental Fig. 1 shows the selection of SNPs in different samples.
Genotyping in replication studies was performed by BeadXpress (Illumina, San Diego, CA) or Assays-on-Demand (Applied Biosystems, Carlsbad, CA) according to manufacturer’s protocol. To confirm accuracy of initial GWAS genotypes, all GWAS participants were retyped for each SNP in replication studies, and these genotypes were used in subsequent analyses. Forty-five SNPs with large differences in allele frequency between American Indian and European populations (13) were genotyped for estimation of the proportion of European heritage, utilizing the method of Hanis et al. (14), for use as a covariate.
Statistical Analysis
Association between young-onset T2DM and each SNP in the GWAS was analyzed by logistic regression under an “additive” model in which a numeric variable (0,1,2) is assigned based on the number of referent alleles. A class D regressive model was used to account for resemblance among siblings by including sample prevalence of young-onset diabetes among siblings as a covariate (15). Genomic control (16) was used to account for inflation of significance due to additional population stratification; the inflation parameter was calculated as the mean χ2 statistic among all SNPs.
A family-based test of association among siblings discordant for diabetes was conducted by conditional logistic regression. To augment statistical power, the P value was calculated by combining the P value from conditional logistic regression (Psib) with a truncated 1-sided P value from the case-control analysis (PCC1). The family-based P value is thus taken from χ2=−2*ln(Psib)−2*ln(max{Psib,[1-(1-PCC1)2]}on four df. This enhances power of the family-based test while maintaining robustness to population stratification (17).
Associations with diabetes in replication studies and in the pooled combined data were examined by logistic regression, fit by the generalized estimating equation procedure to account for dependence among siblings. Association with continuous variables was analyzed similarly with a linear “mixed” model. Values were logarithmically transformed, and the regression coefficient was exponentiated to obtain the effect estimate expressed a multiplier. The logarithms of homeostasis model assessment values were standardized within different insulin assays; effect sizes are presented in SD units. All P values presented are two-sided. To compare Pima results with those in Europeans, publicly available results were obtained from the DIAbetes Genetics Replication And Meta-analysis (DIAGRAM) consortium (1). Heterogeneity between Pimas and Europeans was analyzed by the Q-statistic.
Functional Studies
Overexpression and knockdown of DNER were assessed in murine pancreatic β-cells (NIT1). For overexpression, cells were transfected with 2 μg of pCMV6 expression vector (OriGene, Rockville, MD) containing DNER insert or empty vector control using Lipofectamine LTX (Life Technologies, Carlsbad, CA). For knockdown studies, cells were transfected with 150 pmol small interfering RNA (siRNA) targeting DNER or negative control siRNA using Lipofectamine RNAiMAX. Cells were harvested after 48 h incubation, and total RNA was isolated using the RNeasy mini kit (Qiagen, Valencia, CA). Residual genomic DNA was eliminated by on-column DNAase digestion. First strand cDNA was synthesized using the Advantage RT-for-PCR kit (Clontech, Mountain View, CA). mRNA levels were quantified by real-time PCR using SYBR green on an ABI 7900HT-Fast RT-PCR System (Life Technologies). Relative mRNA level was taken as the ratio of experimental data to control. Data were averaged from 7–8 transfection experiments.
Results
GWAS
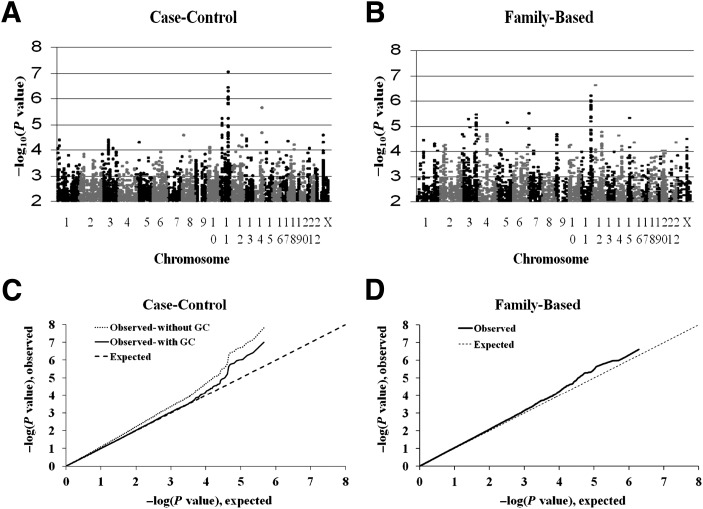
Among the 453,654 SNPs, the genomic inflation factor was 1.13 for the case-control test and 1.02 for the family-based conditional logistic regression test. Results of the GWAS are shown in Fig. 1. There were 260 SNPs with P < 0.0003 in the family-based analysis and 242 SNPs with P < 0.0005 in the case-control analysis (P value thresholds were taken to select ∼250 SNPs); three SNPs met both criteria. Among these 499 SNPs, 319 tags were selected for genotyping in replication studies (with r2 > 0.95 taken as indicative of redundancy).
Figure 1.
A: “Manhattan” plot of genome-wide association results for young-onset T2DM in American Indians in case-control study. The negative base 10 logarithm of the P value for an association with diabetes is plotted against chromosome and position (determined in Build 37). Results are shown after genomic control. B: “Manhattan” plot of genome-wide association results for young-onset T2DM in American Indians in family-based analysis. The negative base 10 logarithm of the P value for an association with diabetes is plotted against chromosome and position (determined in Build 37). C: Quantile–quantile plot of observed vs. expected (given the null distribution) P value for the case-control study. The observed distribution of P values without genomic control is shown in the dotted line, and the distribution with genomic control is shown in the solid line. D: Quantile–quantile plot of observed vs. expected (given the null distribution) P value for the family-based study. The expected distribution was estimated from simulation of 108 test statistics with the observed correlation (r = 0.29) between those for the conditional logistic regression and case-control analyses. GC, genomic control.
Replication Studies
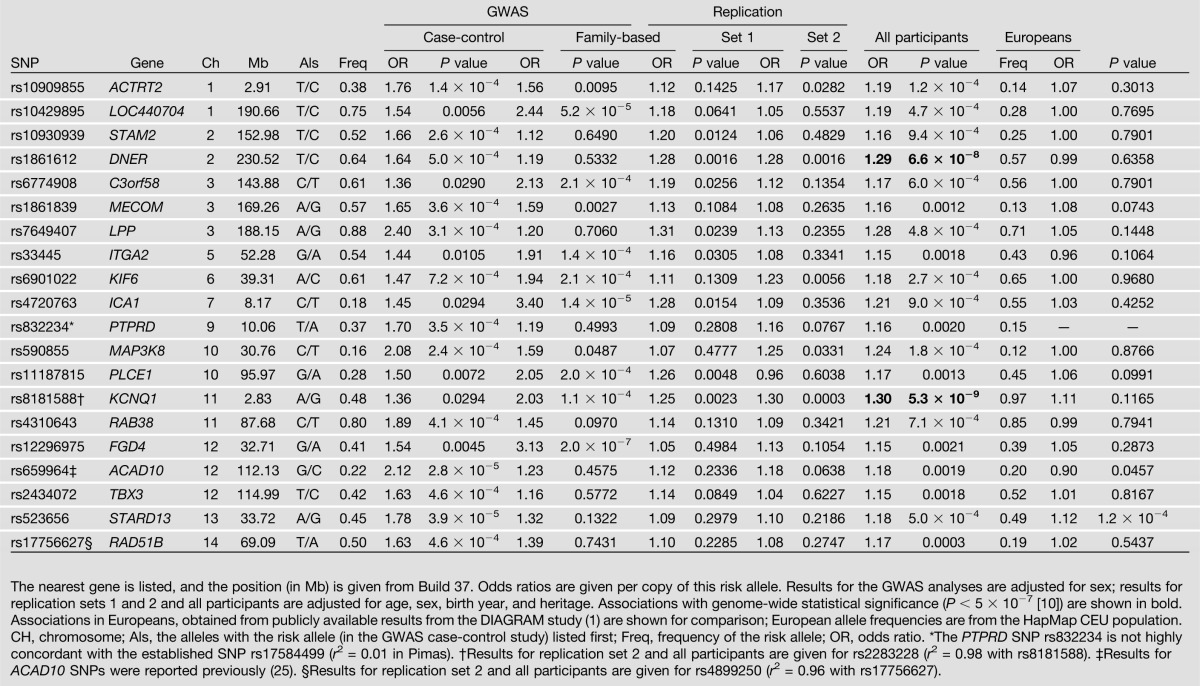
Results for replication studies are shown in Supplementary Table 2. Among 311 SNPs genotyped in the first replication sample, 41 showed directionally consistent association with P < 0.10. Ninety-six of the 311 SNPs, constituting 26 SNPs with P < 0.001 in the combined GWAS and first replication set and 70 “candidate” SNPs, were also genotyped in the second replication sample. The 20 SNPs with the strongest associations in all 7,674 individuals are shown in Table 1. Two SNPs, rs8181588 in KCNQ1 and rs1861612 in DNER, showed consistent and statistically strong (P < 5 × 10⁻⁷) evidence for association across all samples. The KCNQ1 SNP tags rs2283228 (r2 = 0.98), a previously established marker for T2DM (4). The DNER SNP has not been reported in other studies of T2DM, and the effect of rs1861612 is significantly different between Europeans and Pimas (P = 1.6 × 10⁻⁶; I2 = 95.6%).
Table 1.
Twenty SNPs with the strongest association with T2DM diabetes in all American Indian participants

Associations With Metabolic Traits
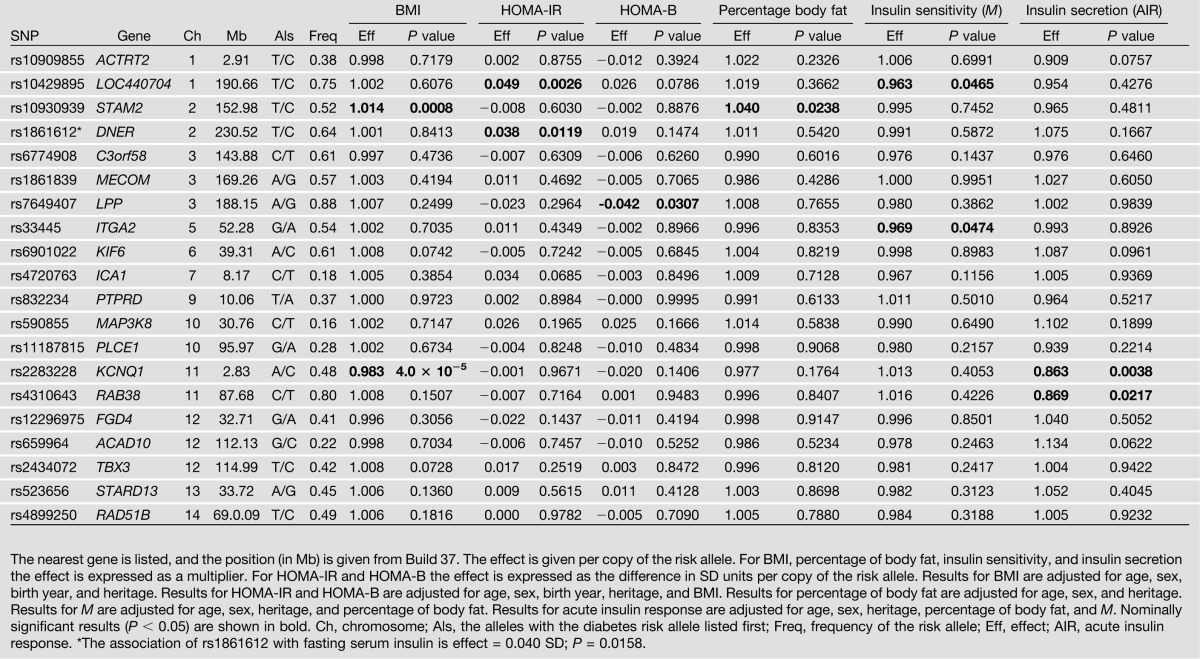
Associations with metabolic traits are shown in Table 2. The diabetes risk allele at rs2283228 in KCNQ1 was associated with lower insulin secretion (by 13.7% per copy of the risk allele; P = 0.0038). The diabetes risk allele at rs1861612 in DNER was associated with increased HOMA-IR and increased fasting serum insulin (∼0.04 SD per copy of the risk allele; P = 0.0119).
Table 2.
Associations of GWAS-derived SNPs with quantitative metabolic constituents of T2DM

Fine Mapping and Functional Studies
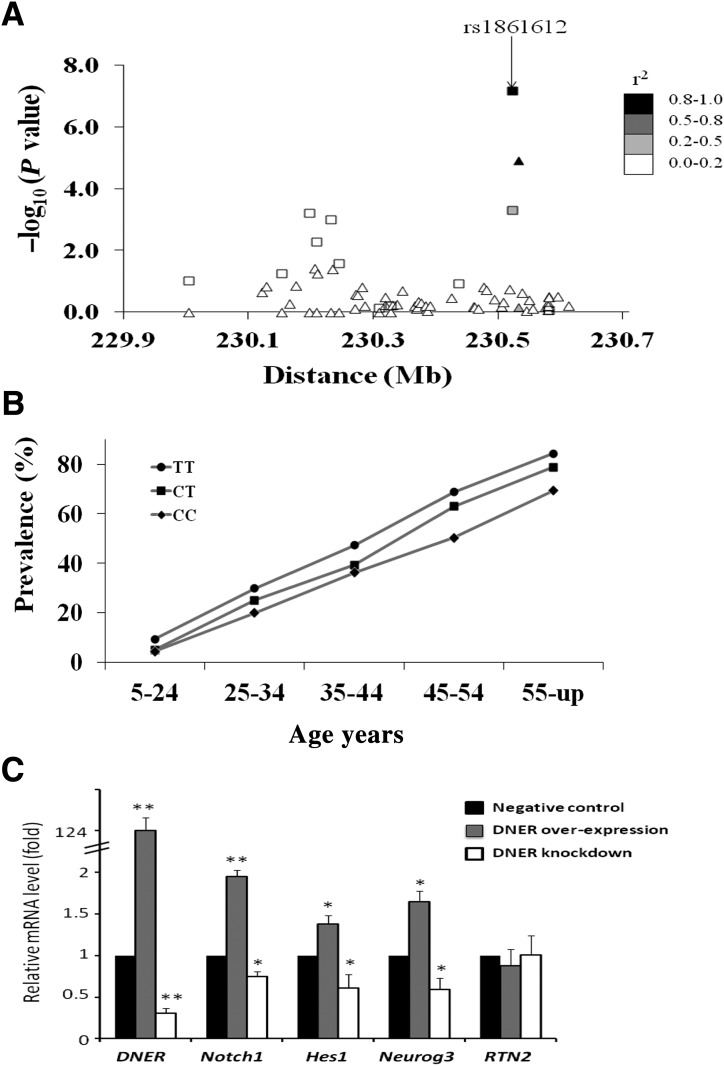
Sixty-three variants in DNER were selected from the GWAS and from direct sequencing of exons and ∼2 kb of the promoter region in 12 diabetic and 12 nondiabetic Pimas. Results for association with diabetes are shown in Fig. 2A. The initial GWAS SNP, rs1861612, was the most strongly associated variant. The association was consistent across age-groups (Fig. 2B).
Figure 2.
A: Association results for 63 variants across DNER with T2DM in Pima Indians. The negative base 10 logarithm of the P value for association is shown at the Build 37 position. Variants include 48 “tags” (r2 >0.8) for 153 SNPs from the GWAS and 14 variants identified from sequencing ∼5,300 base pairs in DNER; one variant identified by sequencing (a short insertion/deletion at position 230.580216 Mb) is not in public databases. Results obtained in all 7,674 individuals are shown as boxes, while those obtained in the GWAS and first replication samples are shown as triangles. Symbols are shaded according to r2 with rs1861612. B: The prevalence of T2DM by genotype at rs1861612 and age-group in 7,674 Pima Indians. P values for association with T2DM in each age-group are as follows: P = 0.0005 (5–24), P = 0.0517 (25–34), P = 0.0265 (35–44), P = 0.0004 (45–54), and P = 0.0028 (55 and up). C: Relative mRNA level in murine pancreatic β-cells after transfection experiments to overexpress DNER (gray bars) or to knockdown DNER expression (open bars) compared with negative control (black bars, which = 1 by definition). mRNA levels are shown for DNER itself, for notch pathway genes (Notch1, Hes1, Neurog3) and for Rtn2 (which is not involved in the notch pathway). *P < 0.001; **P < 0.0001.
To investigate the role of DNER in regulating the notch signaling pathway, DNER mRNA was overexpressed (124-fold enrichment) and knocked down via siRNA (69% reduction) in murine β-cells, and expression levels of four genes were measured. The mRNA of notch pathway-specific genes Notch1, Hes1, and Neurog3 were increased by 2.0-, 1.4-, and 1.6-fold, respectively (P < 0.001), in response to DNER overexpression and decreased by 25, 40, and 41% (P < 0.001) in response to DNER knockdown (Fig. 2C). In contrast, Rtn2, which is not involved in the notch pathway, was largely unaffected.
Discussion
A number of genetic variants have recently been identified as associated with T2DM (1–6). Most of these variants were identified in GWASs in Europeans, but associations for many are consistent in other ethnic groups, including American Indians (18,19). However, some associations are heterogeneous across ethnic groups (5,6,20). In Pima Indians, for example, TCF7L2 variants, which are strongly associated in most ethnic groups, show little association with diabetes (20). In addition because of ethnic differences in allele frequencies, relative importance of different diabetes-susceptibility alleles varies. For these reasons, GWASs in non-European populations might yield additional T2DM susceptibility variants. Indeed, studies in East Asians and South Asians have identified additional diabetes associations (4–6).
There have been few GWASs in American Indians despite their high risk for T2DM. In the current study, we extend our initial GWAS in Pima Indians (7) to include 453,654 SNPs. We also conduct additional replication studies in the population, so associations were ultimately assessed in 7,674 individuals. These studies implicate DNER as a novel locus conferring susceptibility to T2DM. The association with rs1861612 in DNER is reproducible across different groups of Pimas but is not observed in Europeans. Other ethnic-specific genetic associations for T2DM have been described (5,6). Such associations may occur due to difference in frequency of functional alleles, differences in linkage disequilibrium, or interaction with other genetic or environmental factors. Studies of DNER polymorphisms in other populations are required to determine generalizability.
Stringent criteria for statistical significance are generally applied in GWASs on account of multiple statistical testing. In non-African populations, P < 5 × 10⁻⁸ is conventionally considered genome-wide significance. In the current study, only a variant in the established diabetes gene KCNQ1 achieved this threshold. Associations with KCNQ1 variants, which are subject to parent-of-origin effects, are particularly strong in Pimas (21). Conventional criteria for genome-wide significance were derived from estimates of the number of effectively independent common variants in European and East Asian populations (22,23), and this number is likely smaller in Pimas. In fact, we estimate that P < 5 × 10⁻⁷ is an appropriate level for genome-wide statistical significance in Pimas (10), and the DNER association achieves this criterion. Although many of the other established T2DM-susceptibility loci appear to influence diabetes risk in Pimas (19), their effects are modest and difficult to detect at genome-wide significance with the current sample. The present GWAS was small and had little power in itself to detect associations at genome-wide significance.
The mechanism by which variation in DNER might cause T2DM is not clear. DNER encodes a Δ/notch-like epidermal-growth-factor-related receptor, and it mediates notch signaling. We show that DNER expression affects expression of several notch pathway genes in pancreatic β-cells. The diabetes risk allele at rs1861612 was associated with fasting hyperinsulinemia and elevated HOMA-IR, but there was no association with directly measured insulin resistance. A speculative mechanism is that DNER-mediated alterations in notch signaling may produce fasting hyperinsulinemia, which increases risk of diabetes independently of insulin resistance (24), but further mechanistic studies are required. Regardless of the mechanism, the current study implicates DNER as a T2DM-susceptibility gene in American Indians.
Article Information
Acknowledgments. The authors thank the participants who volunteered for the study and the staff of the Phoenix Epidemiology and Clinical Research Branch who provided assistance.
Funding. This work was supported, in part, by the intramural research program of the National Institute of Diabetes and Digestive and Kidney Diseases and, in part, by an award (7-04-DCS-02) to C.B. from the American Diabetes Association.
Duality of Interest. No potential conflicts of interest relevant to this article were reported.
Author Contributions. R.L.H. wrote the manuscript, researched data, and contributed to discussion. Y.L.M., S.K., T.G., L.B., V.O., K.W., J.S., C.W., D.M., K.H., M.A., M.T., E.J.W., R.G.N., P.H.B., W.C.K., C.B., and L.J.B. all researched data, contributed to discussion, and reviewed/edited the manuscript. R.L.H. is the guarantor of this work and, as such, had full access to all the data in the study and takes responsibility for the integrity of the data and the accuracy of the data analysis.
Prior Presentation. Parts of this study were presented at the 70th Scientific Sessions of the American Diabetes Association, Orlando, FL, 25–29 June 2010.
Footnotes
This article contains Supplementary Data online at http://diabetes.diabetesjournals.org/lookup/suppl/doi:10.2337/db13-0416/-/DC1.
References
- 1.Zeggini E, Scott LJ, Saxena R, et al. Wellcome Trust Case Control Consortium Meta-analysis of genome-wide association data and large-scale replication identifies additional susceptibility loci for type 2 diabetes. Nat Genet 2008;40:638–645 [DOI] [PMC free article] [PubMed] [Google Scholar]
- 2.Voight BF, Scott LJ, Steinthorsdottir V, et al. MAGIC investigators. GIANT Consortium Twelve type 2 diabetes susceptibility loci identified through large-scale association analysis. Nat Genet 2010;42:579–589 [DOI] [PMC free article] [PubMed] [Google Scholar]
- 3.Morris AP, Voight BF, Teslovich TM, et al. Wellcome Trust Case Control Consortium. Meta-Analyses of Glucose and Insulin-related traits Consortium (MAGIC) Investigators. Genetic Investigation of ANthropometric Traits (GIANT) Consortium. Asian Genetic Epidemiology Network–Type 2 Diabetes (AGEN-T2D) Consortium. South Asian Type 2 Diabetes (SAT2D) Consortium. DIAbetes Genetics Replication And Meta-analysis (DIAGRAM) Consortium Large-scale association analysis provides insights into the genetic architecture and pathophysiology of type 2 diabetes. Nat Genet 2012;44:981–990 [DOI] [PMC free article] [PubMed] [Google Scholar]
- 4.Unoki H, Takahashi A, Kawaguchi T, et al. SNPs in KCNQ1 are associated with susceptibility to type 2 diabetes in East Asian and European populations. Nat Genet 2008;40:1098–1102 [DOI] [PubMed] [Google Scholar]
- 5.Cho YS, Chen CH, Hu C, et al. DIAGRAM Consortium. MuTHER Consortium Meta-analysis of genome-wide association studies identifies eight new loci for type 2 diabetes in east Asians. Nat Genet 2012;44:67–72 [DOI] [PMC free article] [PubMed] [Google Scholar]
- 6.Saxena R, Saleheen D, Been LF, et al. ; DIAGRAM; MuTHER; AGEN. Genomewide association study identifies a novel locus contributing to type 2 diabetes susceptibility in Sikhs of Punjabi origin from India. Diabetes 2013;62:1746–1755 [DOI] [PMC free article] [PubMed] [Google Scholar]
- 7.Hanson RL, Bogardus C, Duggan D, et al. A search for variants associated with young-onset type 2 diabetes in American Indians in a 100K genotyping array. Diabetes 2007;56:3045–3052 [DOI] [PubMed] [Google Scholar]
- 8.Knowler WC, Pettitt DJ, Saad MF, Bennett PH. Diabetes mellitus in the Pima Indians: incidence, risk factors and pathogenesis. Diabetes Metab Rev 1990;6:1–27 [DOI] [PubMed] [Google Scholar]
- 9.American Diabetes Association Expert Committee on the Diagnosis and Classification of Diabetes Mellitus Report of the Expert Committee on the Diagnosis and Classification of Diabetes Mellitus. Diabetes Care 1997;20:1183–1197 [DOI] [PubMed] [Google Scholar]
- 10.Malhotra A, Kobes S, Knowler WC, Baier LJ, Bogardus C, Hanson RL. A genome-wide association study of BMI in American Indians. Obesity (Silver Spring) 2011;19:2102–2106 [DOI] [PMC free article] [PubMed] [Google Scholar]
- 11.Matthews DR, Hosker JP, Rudenski AS, Naylor BA, Treacher DF, Turner RC. Homeostasis model assessment: insulin resistance and beta-cell function from fasting plasma glucose and insulin concentrations in man. Diabetologia 1985;28:412–419 [DOI] [PubMed] [Google Scholar]
- 12.Bunt JC, Krakoff J, Ortega E, Knowler WC, Bogardus C. Acute insulin response is an independent predictor of type 2 diabetes mellitus in individuals with both normal fasting and 2-h plasma glucose concentrations. Diabetes Metab Res Rev 2007;23:304–310 [DOI] [PMC free article] [PubMed] [Google Scholar]
- 13.Tian C, Hinds DA, Shigeta R, et al. A genomewide single-nucleotide-polymorphism panel for Mexican American admixture mapping. Am J Hum Genet 2007;80:1014–1023 [DOI] [PMC free article] [PubMed] [Google Scholar]
- 14.Hanis CL, Chakraborty R, Ferrell RE, Schull WJ. Individual admixture estimates: disease associations and individual risk of diabetes and gallbladder disease among Mexican-Americans in Starr County, Texas. Am J Phys Anthropol 1986;70:433–441 [DOI] [PubMed] [Google Scholar]
- 15.Schnell AH, Karunaratne PM, Witte JS, Dawson DV, Elston RC. Modeling age of onset and residual familial correlations for the linkage analysis of bipolar disorder. Genet Epidemiol 1997;14:675–680 [DOI] [PubMed] [Google Scholar]
- 16.Devlin B, Bacanu SA, Roeder K. Genomic control to the extreme. Nat Genet 2004;36:1129–1130; author reply 1131 [DOI] [PubMed] [Google Scholar]
- 17.Hanson RL, Knowler WC. Design and analysis of genetic association studies to finely map a locus identified by linkage analysis: assessment of the extent to which an association can account for the linkage. Ann Hum Genet 2008;72:126–139 [DOI] [PubMed] [Google Scholar]
- 18.Haiman CA, Fesinmeyer MD, Spencer KL, et al. Consistent directions of effect for established type 2 diabetes risk variants across populations: the Population Architecture Using Genomics and Epidemiology (PAGE) Consortium. Diabetes 2012;61:1642–1647 [DOI] [PMC free article] [PubMed] [Google Scholar]
- 19.Rong R, Hanson RL, Ortiz D, et al. Association analysis of variation in/near FTO, CDKAL1, SLC30A8, HHEX, EXT2, IGF2BP2, LOC387761, and CDKN2B with type 2 diabetes and related quantitative traits in Pima Indians. Diabetes 2009;58:478–488 [DOI] [PMC free article] [PubMed] [Google Scholar]
- 20.Guo T, Hanson RL, Traurig M, et al. TCF7L2 is not a major susceptibility gene for type 2 diabetes in Pima Indians: analysis of 3,501 individuals. Diabetes 2007;56:3082–3088 [DOI] [PubMed] [Google Scholar]
- 21.Hanson RL, Guo T, Muller YL, et al. Strong parent-of-origin effects in the association of KCNQ1 variants with type 2 diabetes in American Indians. Diabetes 2013;62:2984–2991 [DOI] [PMC free article] [PubMed] [Google Scholar]
- 22.Dudbridge F, Gusnanto A. Estimation of significance thresholds for genomewide association scans. Genet Epidemiol 2008;32:227–234 [DOI] [PMC free article] [PubMed] [Google Scholar]
- 23.Hoggart CJ, Clark TG, De Iorio M, Whittaker JC, Balding DJ. Genome-wide significance for dense SNP and resequencing data. Genet Epidemiol 2008;32:179–185 [DOI] [PubMed] [Google Scholar]
- 24.Weyer C, Hanson RL, Tataranni PA, Bogardus C, Pratley RE. A high fasting plasma insulin concentration predicts type 2 diabetes independent of insulin resistance: evidence for a pathogenic role of relative hyperinsulinemia. Diabetes 2000;49:2094–2101 [DOI] [PubMed] [Google Scholar]
- 25.Bian L, Hanson RL, Muller YL, et al. MAGIC Investigators Variants in ACAD10 are associated with type 2 diabetes, insulin resistance and lipid oxidation in Pima Indians. Diabetologia 2010;53:1349–1353 [DOI] [PMC free article] [PubMed] [Google Scholar]


