Figure 2.
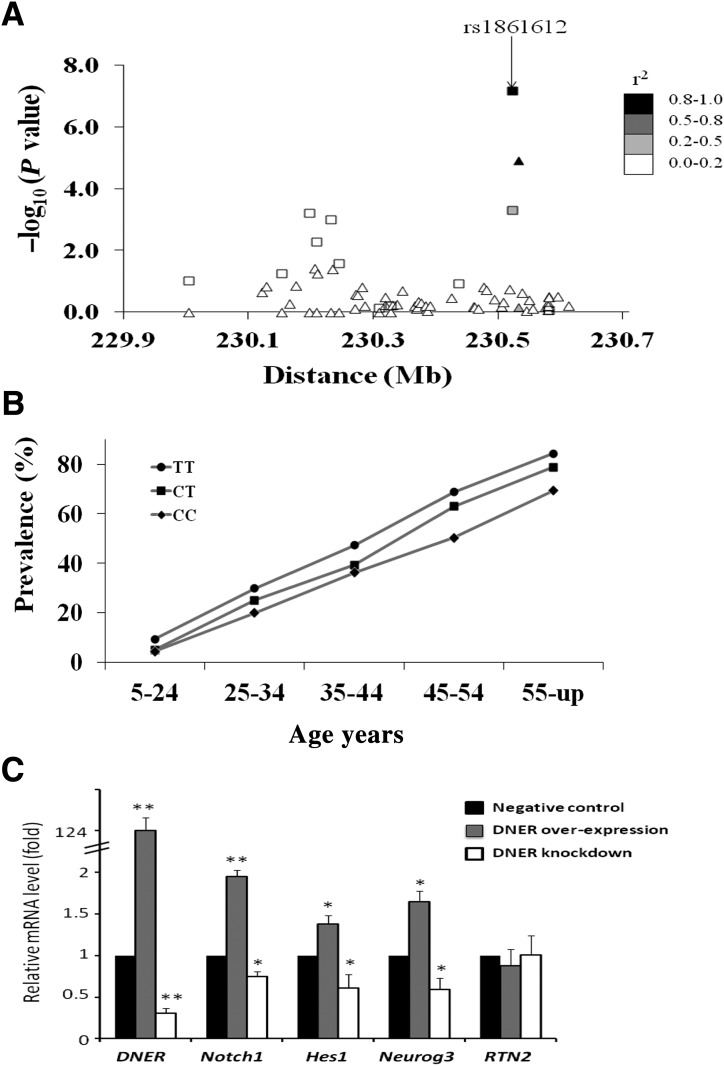
A: Association results for 63 variants across DNER with T2DM in Pima Indians. The negative base 10 logarithm of the P value for association is shown at the Build 37 position. Variants include 48 “tags” (r2 >0.8) for 153 SNPs from the GWAS and 14 variants identified from sequencing ∼5,300 base pairs in DNER; one variant identified by sequencing (a short insertion/deletion at position 230.580216 Mb) is not in public databases. Results obtained in all 7,674 individuals are shown as boxes, while those obtained in the GWAS and first replication samples are shown as triangles. Symbols are shaded according to r2 with rs1861612. B: The prevalence of T2DM by genotype at rs1861612 and age-group in 7,674 Pima Indians. P values for association with T2DM in each age-group are as follows: P = 0.0005 (5–24), P = 0.0517 (25–34), P = 0.0265 (35–44), P = 0.0004 (45–54), and P = 0.0028 (55 and up). C: Relative mRNA level in murine pancreatic β-cells after transfection experiments to overexpress DNER (gray bars) or to knockdown DNER expression (open bars) compared with negative control (black bars, which = 1 by definition). mRNA levels are shown for DNER itself, for notch pathway genes (Notch1, Hes1, Neurog3) and for Rtn2 (which is not involved in the notch pathway). *P < 0.001; **P < 0.0001.

