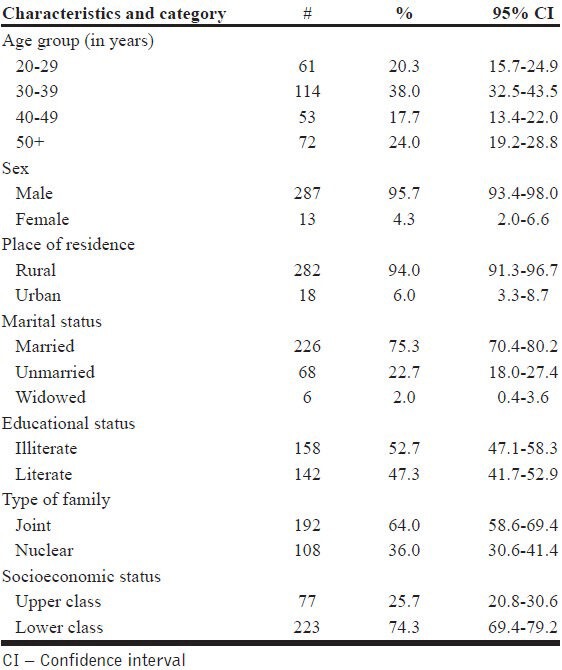
Table 1.
Number (#) and proportion (%) of subjects (n=300) according to different sociodemographic characteristics and reasons for crime along with 95% confidence interval

Number (#) and proportion (%) of subjects (n=300) according to different sociodemographic characteristics and reasons for crime along with 95% confidence interval
