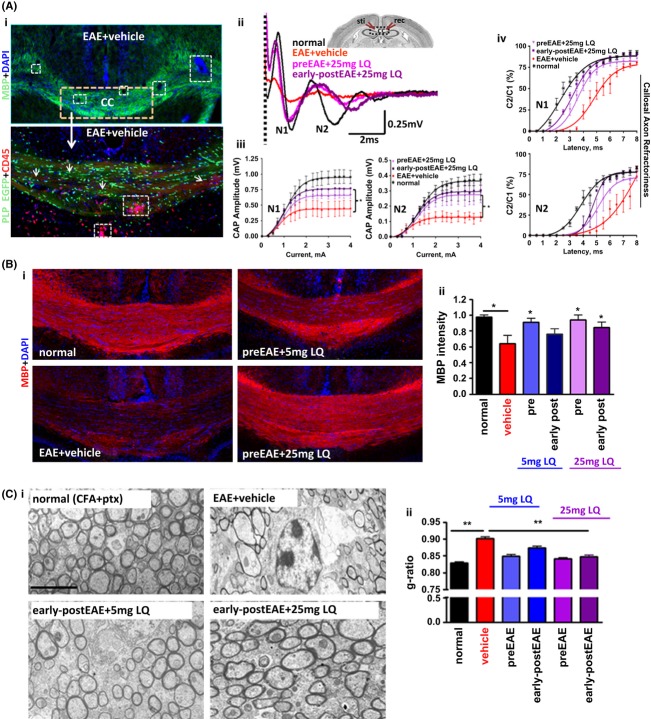
Figure 4.
Treatment with laquinimod (LQ) decreases EAE-induced callosal conduction and myelination deficit. (A) Callosal lesions and demyelination during chronic EAE. (ii) Representative brain section containing CC white matter tracts from the PLP_EGFP group with late EAE was immunostained with MBP (green) + DAPI (red) and imaged at 4× magnification. Consecutive brain section from the same group immunostained with CD45+ (red) microglia/macrophage and imaged at 10× show many infiltrating lesions that are periventricular, around blood vessels (white dashed box) and scattered throughout the white matter, as well as decreased PLP_EGFP (green) cells and an increase in DAPI+ nuclei (also see Mangiardi et al. 2011). (ii, iii) Compound action potential (CAP) responses were recorded from slices with midline-crossing segments of the CC overlying the middorsal hippocampus. Stimulating (Sti) and recording (Rec) electrodes were each placed ∼1 mm away from midline. (CC, corpus callosum; Hip, hippocampus; S1, somatosensory cortex; M, motor cortex). Typical CC CAP from normal (black), vehicle-treated EAE (red), 25 mg/kg LQ pretreated EAE (magenta), and 25 mg/kg LQ early post-treated EAE (purple) brain slices evoked (at a stimulus of 4 mA) were recorded on post-immunization day 34. There was a decrease in N1 (fast conducting myelinated component) and N2 (slow conducting, mostly non-myelinated component) CAP amplitude in the vehicle-treated EAE group. Treatment with 25 mg/kg LQ during EAE inhibited the EAE-induced decrease in N1 and N2 CAP amplitude compared to vehicle treatment. Dashed vertical line represents CAP beyond the stimulus artifact (i). Quantification of N1 (ii) and N2 (iii) CAP amplitudes in the CC of vehicle-treated EAE and 25 mg/kg LQ pre- and early post-treatment groups was performed. Average C2/C1 ratios (obtained from plots of mean CAP amplitude) elicited by the second pulse in each paired stimulation (C2), divided by the CAP amplitude to single pulse stimulation (C1) (Crawford et al. 2009a,b, 2010) were fitted to Boltzmann sigmoid curves (iv–v). A rightward shift in curves for N1 and N2 shows decreased refractoriness in the vehicle-treated EAE group (n = 4). Callosal axons of LQ-treated EAE animals show a significant increase (a leftward shift in the curve compared to vehicle treatment) in refractoriness of N1 and N2. The interpulse interval (IPI) values (mean ± SD) of the N1 component are: normal = 2.2 ± 0.1 msec, vehicle-treated EAE 4.8 ± 0.2 msec, LQ pre-EAE = 3.7 ± 0.1 msec, and LQ early post-EAE = 3.1 ± 0.1 msec. The IPI values (mean ± SD) of the N2 component are normal = 3.2 ± 0.2 msec, vehicle-treated EAE = 8.8 ± 2.2 msec, LQ pre-EAE = 5.0 ± 0.2 msec, and LQ early post-EAE = 4.7 ± 0.2 msec. Statistically significant compared with normal controls at 2–4 mA stimulus strength (*P < 0.05; **P < 0.001; ANOVAs; Bonferroni's multiple comparison post-test; n = 6 mice/group). (B) Formalin-fixed brain sections collected from animals perfused on day 34 and brain sections from recorded slices were immunostained with anti-MBP (red) and imaged at 10× magnification. Vehicle-treated mice had reduced MBP immunoreactivity as compared to normal controls, while LQ-treated EAE mice showed relatively preserved MBP staining (i). Upon quantification, MBP immunoreactivity in CC was significantly lower in vehicle-treated EAE mice as compared to normal mice, while EAE mice pre- and early post-treated with LQ demonstrated no significant decreases (except for the 5 mg/kg LQ early post-treated EAE group). Myelin intensity is presented as percent of normal (*P < 0.05; ANOVAs; Bonferroni's multiple comparison post-test; n = 8–10 mice/group). (C) Representative electron micrographs of the CC from normal control, vehicle-treated EAE, and LQ early post-treated EAE mice show differential levels of axon myelination (i–ii). Compared to normal controls, the CC of vehicle-treated EAE mice show increased numbers of non-myelinated axons. Early post-treatment with 5 mg/kg and 25 mg/kg LQ resulted in a dramatic increase in myelinated axons as compared to vehicle-treated EAE mice. Photomicrographs are at 4800×. Scale bar is 1 μm. Axon diameter and fiber diameters of all axons in the field were measured to further quantify the degree of myelination. Axon diameter/fiber diameter (g-ratio) showed a significant increase in vehicle-treated EAE callosal axons and a dramatic decrease in LQ-treated EAE callosal axons (ii). Calculated g-ratio for callosal axons (mean ± SEM) is normal control = 0.83 ± 0.002, EAE+vehicle = 0.90 ± 0.004, pre-EAE+5 mg/kg LQ = 0.85 ± 0.004, pre-EAE+25 mg/kg LQ = 0.84 ± 0.005, early post-EAE+5 mg/kg LQ = 0.87 ± 0.04, and early post-EAE+25 mg/kg LQ = 0.85 ± 0.004. At least four mice from each group were analyzed and a minimum of 500 fibers were measured from each mouse (**P < 0.001; *P < 0.05; ANOVAs; Bonferroni's multiple comparison post-test).

