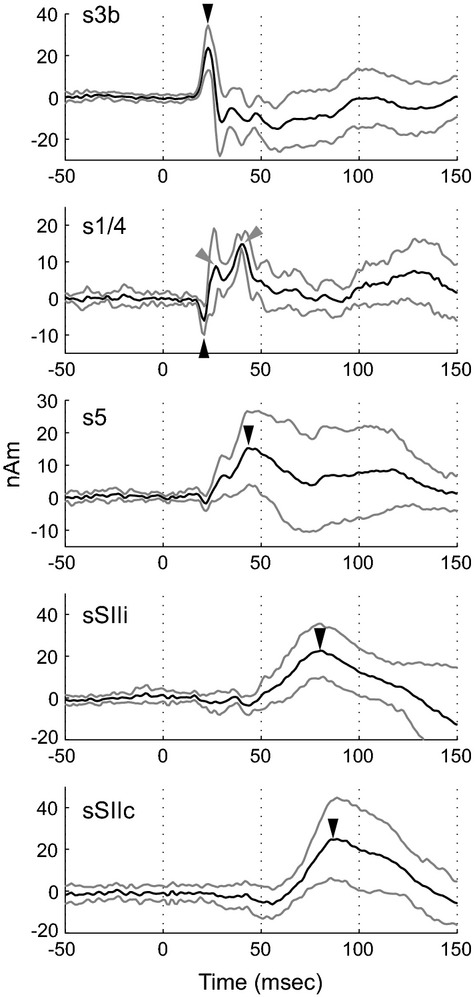
Figure 5.

Grand-averaged source strength waveforms for cortical sources in somatosensory evoked fields (SEFs). From top to bottom panels, solid line represents averaged waveforms for s3b, s1/4, s5, sSIIi, and sSIIc across subjects are shown, whereas the thin lines represents ±SD. In each panel, a closed arrowhead indicates the peak time of initial source activities. Note in panel of s1/4, two additional peaks are indicated by gray arrowheads.
