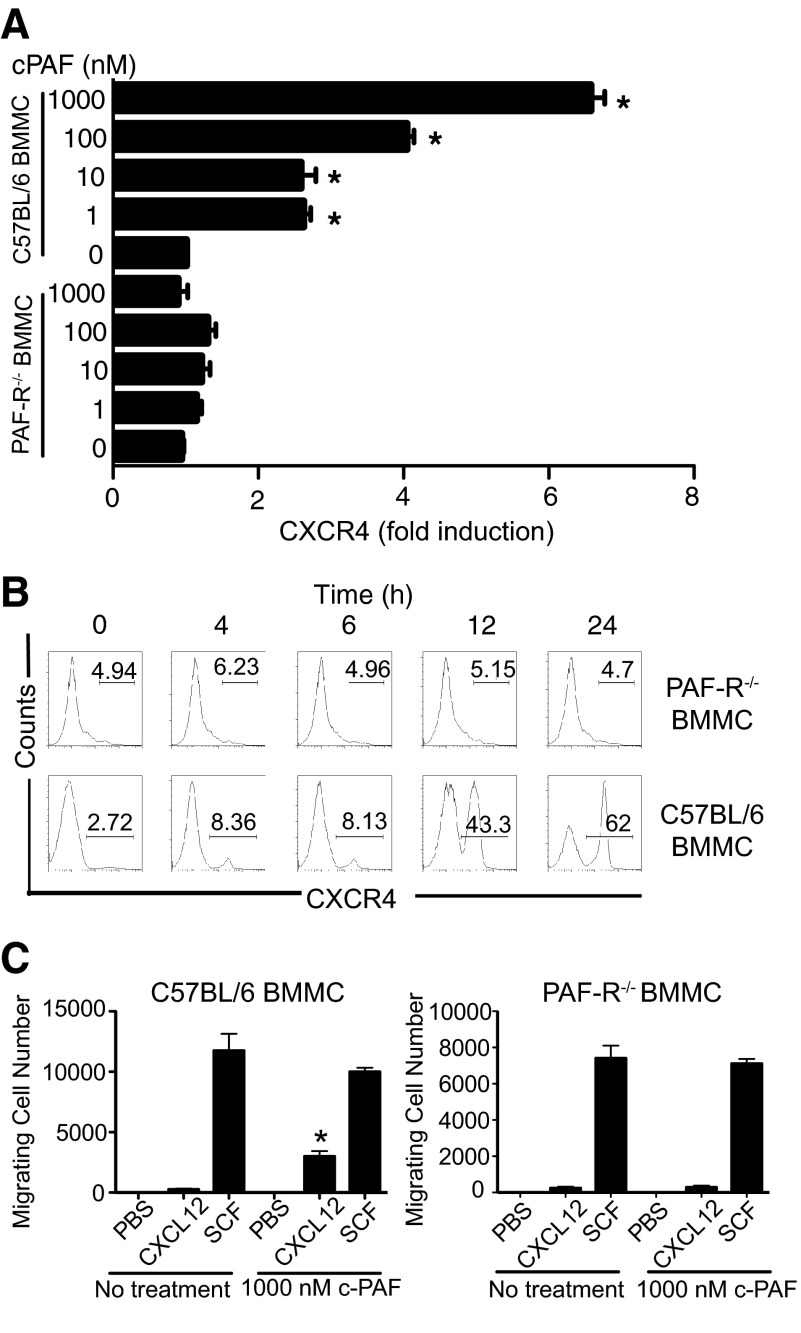
Figure 3. PAF induces mast cell CXCR4 expression.
(A) B6 BMMC and PAFR−/− BMMC were cultured for 24 h with different concentrations of c-PAF, and CXCR4 mRNA was measured by quantitative real-time PCR. Results are expressed as means ± sem. *P = 0.001 versus baseline level. (B) BMMCs were cultured with 1000 nM c-PAF, cells were collected at different times poststimulation, and the CXCR4 surface expression was detected by flow cytometry. (C) BMMCs were cultured overnight with medium (No treatment) or 1000 nM c-PAF and washed, and 3 × 10⁵ cells were added to upper chambers. Migrating cells were counted 5 h later. Results are expressed as means ± sem. *P < 0.05; Migration of cells with no treatment versus migration of cells pretreated with c-PAF. SCF was used as a positive control.

