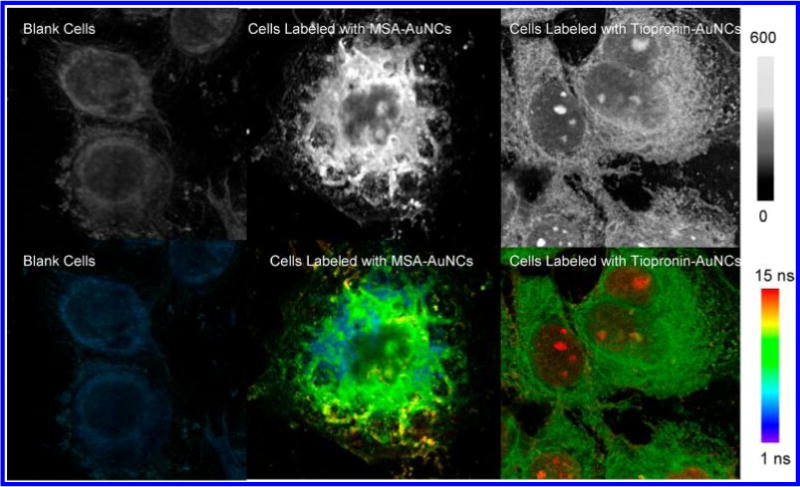
Figure 5.

Fluorescence intensity (upper panel) and lifetime (bottom panel) images of HeLa cells loaded with PEGylated MSA-AuNCs and PEGylated tiopronin-AuNCs, respectively. The cell images were collected from the emission through a 650 nm long-pass filter upon excitation at 470 nm. Fluorescence intensity and lifetime images of blank cells without labeling were also recorded under the same conditions as control. The scales of the diagrams were 80 × 80 μm, and the resolutions of diagrams were 400 × 400 pixels with an integration of 0.6 ms/pixel.
