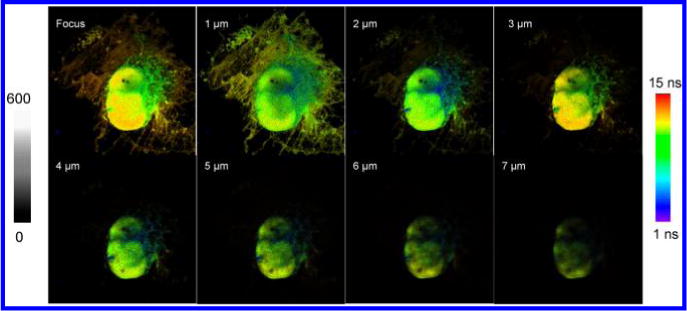
Figure 6.

Fluorescence lifetime images of HeLa cells labeled with PEGylated MSA-AuNCs. The images were collected from the emission through a 650 = long-pass filter upon excitation at 470 nm. The cells were scanned with a focus lifting from the top of the coverslip to different layers of the cell in a scale of 1 μm. The scales of the diagrams were 80 × 80 μm, and the resolutions of diagrams were 400 × 400 pixels with an integration of 0.6 ms/pixel.
