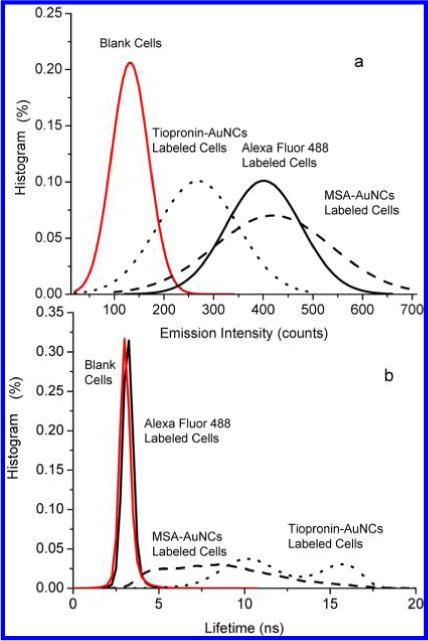
Figure 7.

Histogram distributions of (a) emission intensity and (b) lifetimes over the entire cell images that are loaded by PEGylated MSA-AuNCs and tiopronin-AuNCs. Histogram distributions of emission intensity and lifetimes throughout the entire cell images that were unlabeled or labeled by Alexa Fluor 488 dyes were also presented as references.
