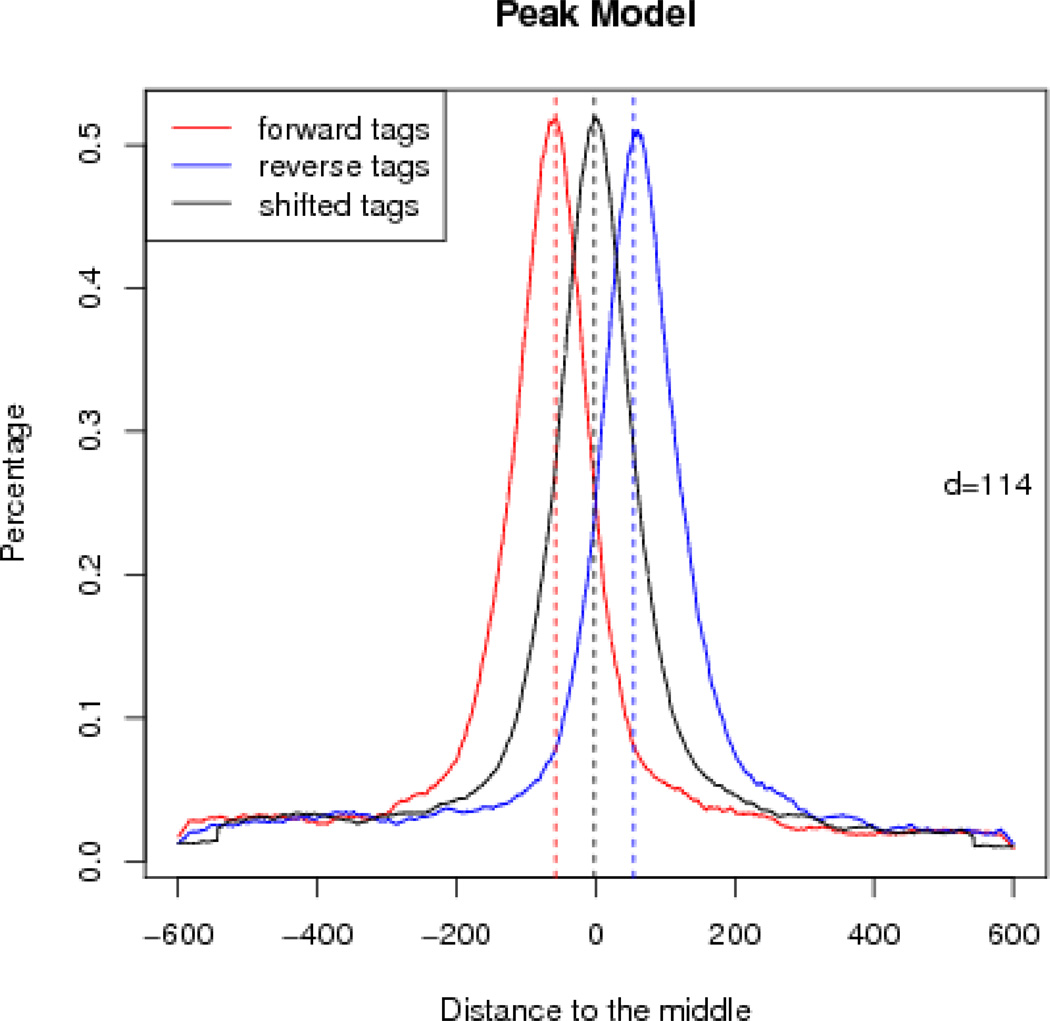
Figure 2.
Peak model built by MACS using the FoxA1 dataset. d=114 represents the estimated DNA fragment size. The red curve represents the percentage of positive strand reads at each base pair, and the blue curve models reads on the negative strand. The black curve illustrates the distribution of reads after shifting them towards the 3’ end by 57=114/2 bp.

