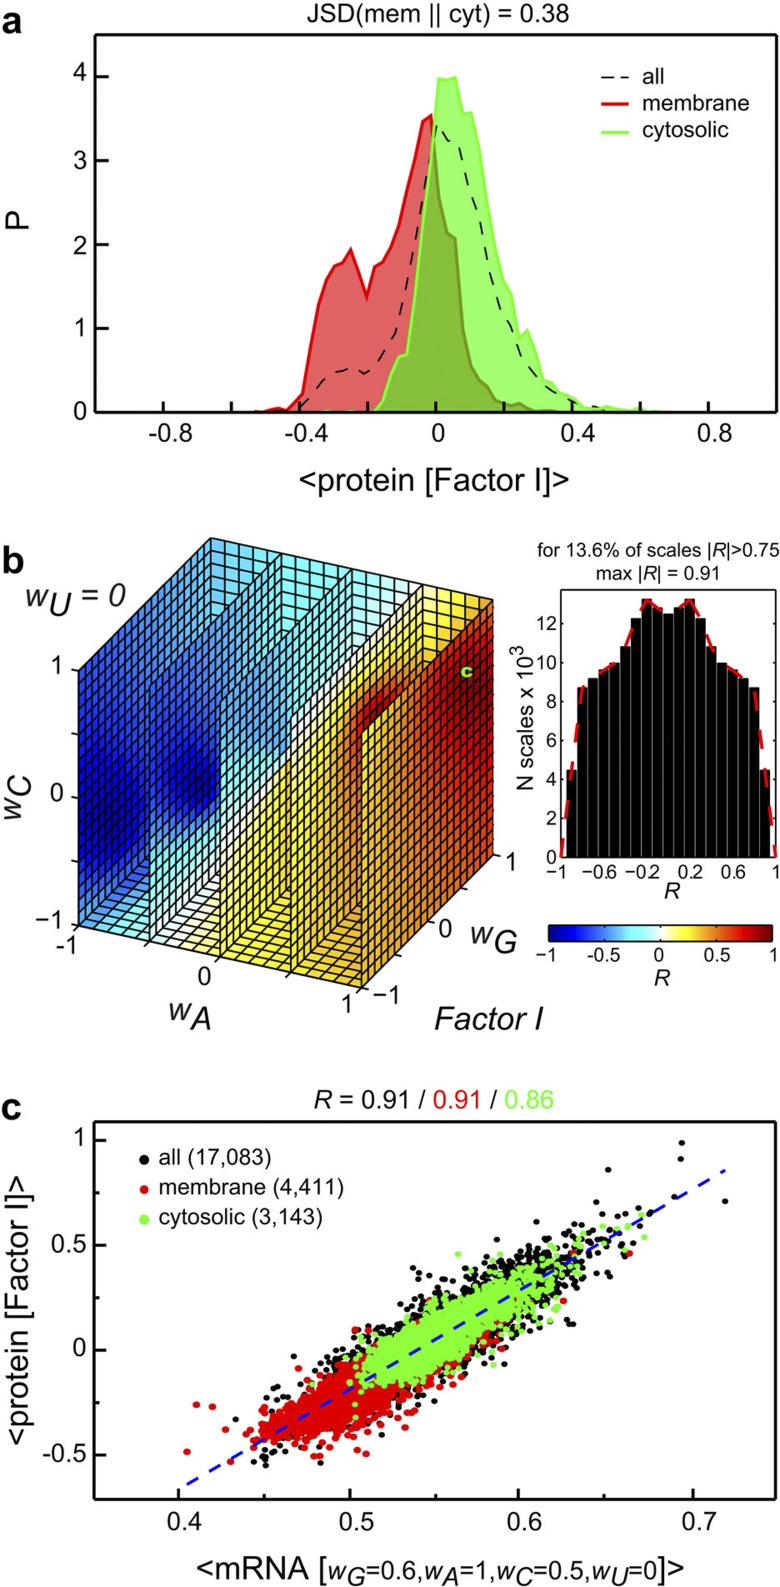
Figure 1. Encoding of average sequence hydrophobicity of proteins in average properties of their cognate mRNA coding sequences.
(a) Distribution of average protein sequence hydrophobicity as calculated according to the Factor I scale for the entire human proteome (dashed curve), annotated membrane proteins (red filled curve) and annotated cytosolic proteins (green filled curve). (b) Distribution of Pearson correlation coefficients R (wG, wA, wC, wU) obtained for the human proteome using the Factor I scale (see Methods) and shown as a 3D projection with a fixed value of wU=0 (left) or as a 1D histogram (right). The cube is coloured according to the R values as given in the colour legend. The nucleotide scale used for the scatter plot in panel c is indicated with ‘c’. (c) Scatter plot of average sequence hydrophobicity of human proteins and generalized average mRNA sequence properties calculated using a nucleotide scale that provides the highest value of |R|. Annotated membrane and cytosolic proteins are depicted in red and green, respectively, while all other proteins are in black.

