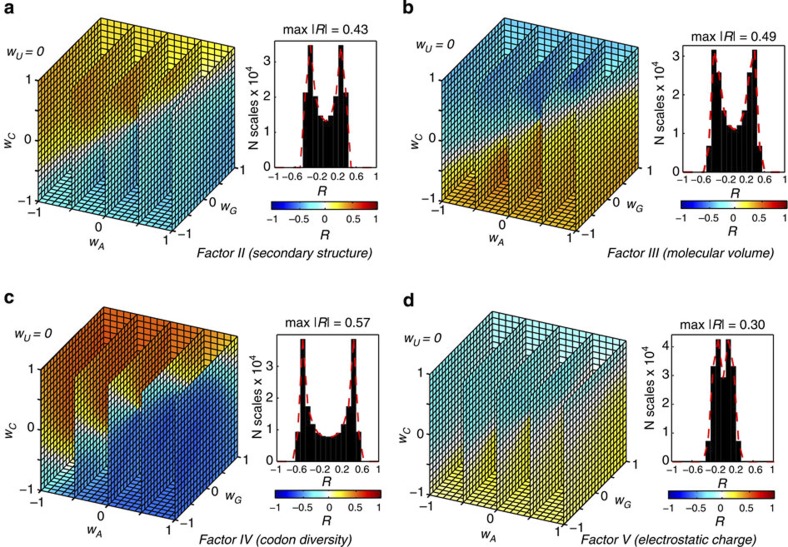
Figure 2. Hydrophobicity-independent average protein sequence properties display a weak connection to cognate mRNA sequences.
Distributions of Pearson correlation coefficients R (wG, wA, wC, wU) obtained for the human proteome using (a) Factor II (secondary structure), (b) Factor III (molecular volume), (c) Factor IV (codon diversity) and (d) Factor V (electrostatic charge) scales, and shown as a 3D projection with a fixed value of wU=0 (left) or as a 1D histogram (right). Cubes are coloured according to the R values as given in the colour legend.

