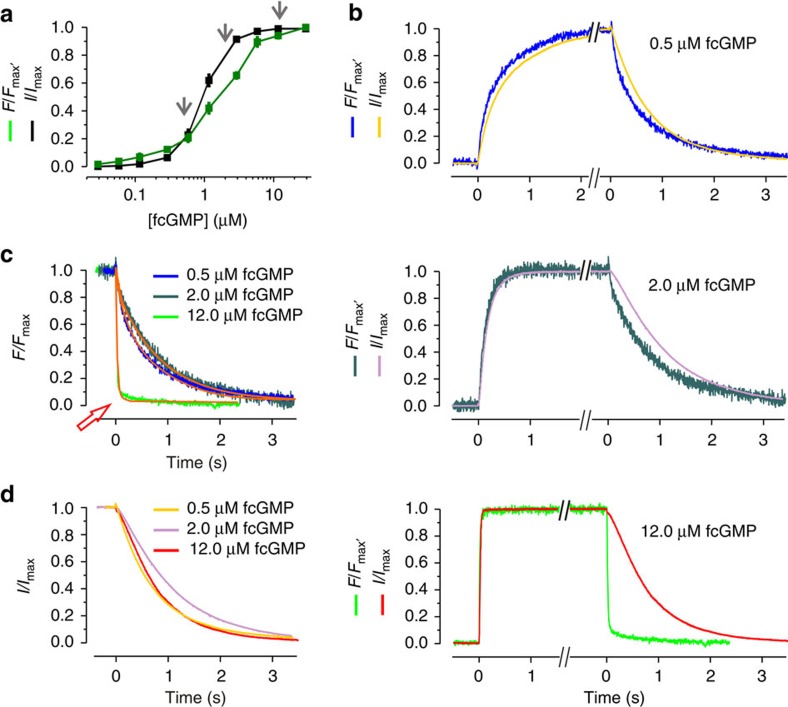
Figure 1. Experimental data of fcGMP binding and gating in CNGA2 channels.
(a) Concentration–binding relationship and concentration–activation relationship under steady-state conditions over a wide concentration range between 30 nM and 29.1 μM. Each data point is the mean of measurements obtained from 6 to 15 patches. Error bars denote s.e.m. The arrows indicate the concentrations used for the analyses of the time courses as shown in b. (b) Time courses of activation and deactivation as well as fcGMP binding and unbinding following a concentration pulse to either 0.5 μM (13.0 s), 2.0 μM (7.5 s), or 12.0 μM (9.0 s) fcGMP and back to zero. The traces are averages of 7, 7, 10 currents, respectively, arising from different patches. For better comparison the traces were graphically cut after reaching a steady state. All traces were normalized with respect to the late current (I/Imax) or late fluorescence intensity (F/Fmax). (c) Superimposition of the time courses of ligand unbinding. The colours correspond to b. The orange curves indicate monoexponential fits yielding the time constants for the ligand unbinding starting from different fcGMP concentrations. The red arrow indicates the unbinding time course at 12.0 μM fcGMP, which is ~50 times faster than the unbinding at the two lower concentrations. The obtained time constants are: 20.5 ms from 12 μM fcGMP, 943.2 ms from 2.0 μM fcGMP and 796.3 ms from 0.5 μM fcGMP. (d) Superimposition of the deactivation time courses. The colors correspond to b.

