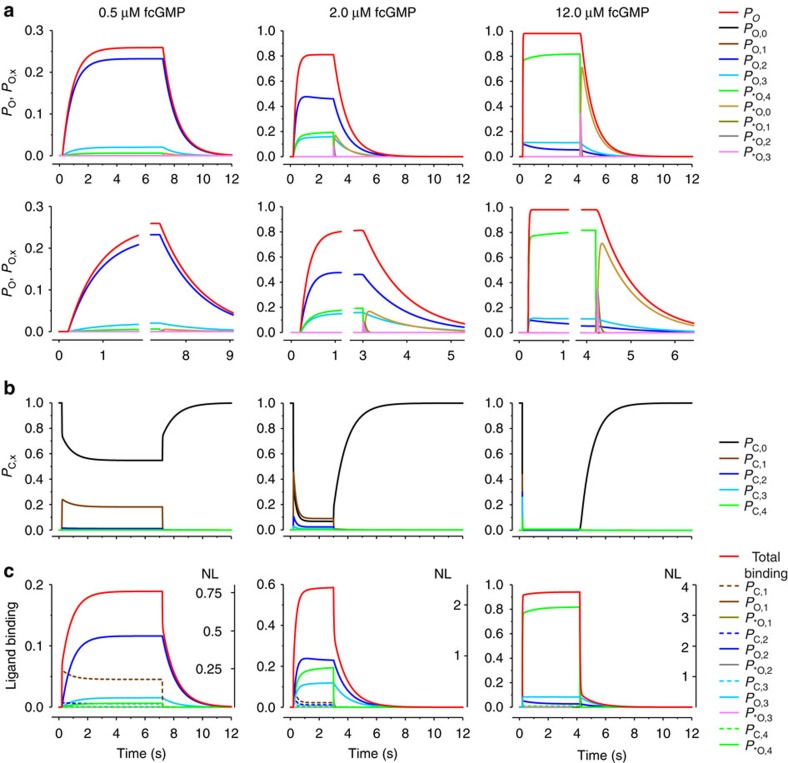
Figure 4. Time-dependent state population in the C4L-*O4L model.
Using the parameters given in Fig. 3a, the population of all states in the C4L-*O4L model was computed for three fcGMP concentrations. (a) Upper time courses: open probability, Po (red curve, same curves as in Fig. 3b) and probability of being either in Ox, PO,x (x=0….3) or *Ox, P*O,x (x=0….4; coloured curves). The PO,x and P*O,x values sum up to Po. Lower time courses: part of the respective upper time courses at an expanded timescale. (b) Probability of being in the closed state x, PC,x (x=0….4). The PO,x, P*O,x, and PC,x, values sum up to unity. (c) Ligand binding to the total channel (red curve) to the individual open (x/4 × PO,x; x/4 × P*O,x; coloured continuous) and closed states (x/4 × PC,x; coloured dashed), given as fraction of unity (left ordinates). x/4 weighs the contribution of each liganded state to the total liganding. NL indicates the number of ligands bound to the channel and to the individual states under the assumption that maximally four ligands can bind to the channel (right ordinate).

