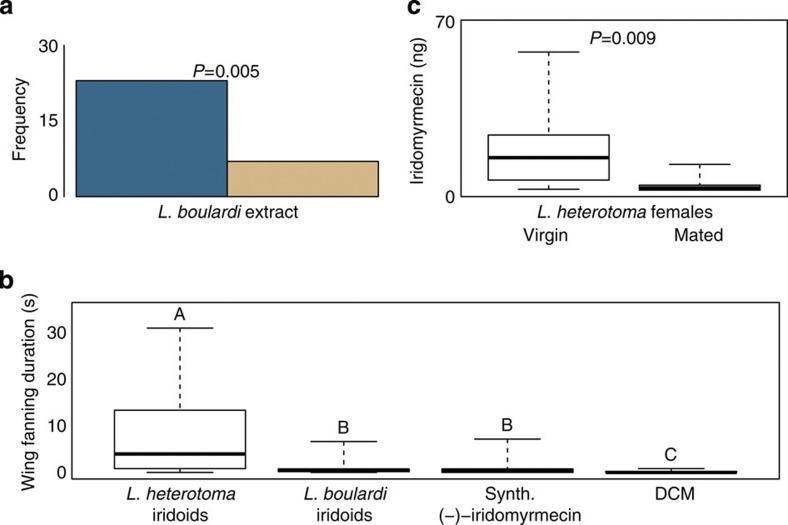
Figure 6. Species-specificity and released amounts of the sex pheromone.
(a) Frequency of decision for sample or control of naïve L. heterotoma males in a y-tube experiment when choosing between the control (brown bar) and the extract of virgin L. boulardi females (blue bar). The P-value (rounded to third decimal) is given for the two-sided binomial test; n=30. (b) Box-and-whisker plots showing median (horizontal line), interquartile range (box) and maximum/minimum range (whiskers) of the duration (s) of the courtship behaviour (wing fanning) that naïve L. heterotoma males displayed towards the iridoid fraction of an extract of females of L. heterotoma and L. boulardi, respectively, synthetic (−)-iridomyrmecin and DCM. Different capital letters above box-and-whisker-plots indicate a significant difference between these plots, cases that do not share at least one letter differ significantly (Kruskal–Wallis test followed by pairwise Mann–Whitney U-tests with Bonferroni–Holm correction, P<0.05). For each experiment n=12. (c) Box-and-whisker plots showing median (horizontal line), interquartile range (box) and maximum/minimum range (whiskers) of the amount (ng) of iridomyrmecins released by virgin and mated females of L. heterotoma. The P-value (rounded to third decimal) is given for the Mann–Whitney U-test; n=13.

