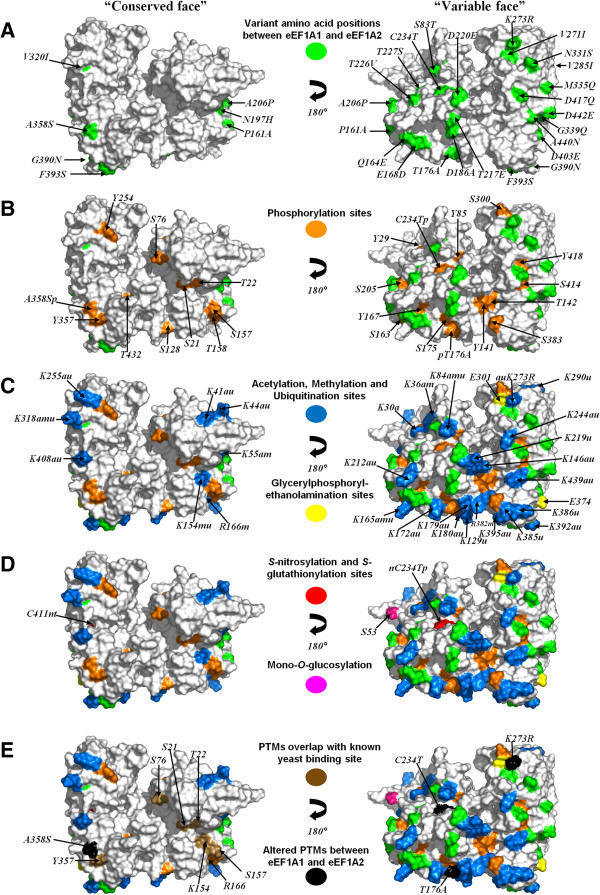
Figure 1.
Post-translational modification and eEF1A1 and eEF1A2. All known PTMs are mapped on the surface of the 3-D model of eEF1A1 are shown in the two views (the “conserved face” and the “variable face”) rotated by 180° about the y-axis: (A) location of variant amino acids between eEF1A1 and eEF1A2 (green); (B) phosphorylation sites (orange); (C) acetylation (blue), methylation (blue), ubiquitination (blue) and ethanolamination (yellow) sites; (D)S-nitrosylation (red), S-glutathionylation (red) and O-glucosylation sites (pink); (E) overlap of post-translational modifications with known binding sites (brown) and altered PTMs between eEF1A1 and eEF1A2 (black). All surface-exposed variant amino acid residues between eEF1A1 and eEF1A2 and PTMs are labelled; where a residue is modified in more than one way or altered between the two isoforms, this is indicated on the residue (a = acetylated; m = methylated; n = S-nitrosylated; p = phosphorylated; t = S-glutathionylated; u = ubiquitinated).

