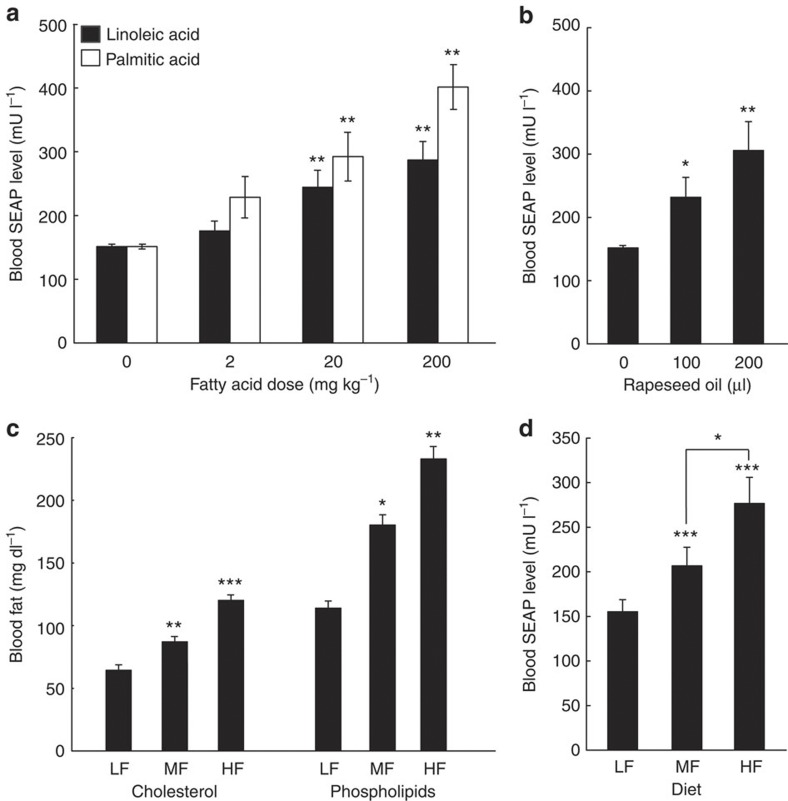
Figure 3. Performance of fatty acid-inducible expression control in wild-type mice.
(a–d) Standard low fat-fed wild-type mice were implanted with per microencapsulated pKR135-/pMG10-transgenic HT-1080 (2 × 10⁶ cells per mouse) and received different doses of linoleic/palmitic acids (a), rapeseed oil (b) or were put on standard LF, (5 kcal% fat), MF (10 kcal% fat) and HF (60 kcal% fat) diets (c,d). Resulting blood SEAP levels (a,b,d) and blood fat levels represented by serum cholesterol and phospholipid concentrations (c) were quantified after 48 h (a,b,d) or 72 h (c). Data are mean ±s.e.m., statistics by two-tailed Student’s t-test; n=8 mice per group. *P<0.05, **P<0.005, ***P<0.0001 versus zero lipid doses (a,b) or LF mice (c,d).

