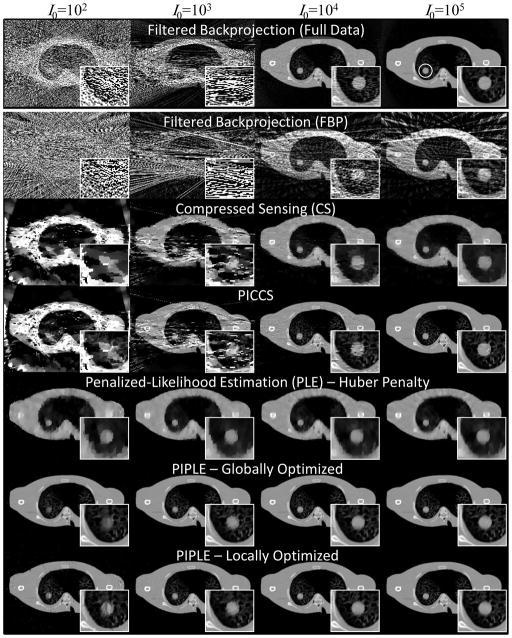
Figure 6.
Qualitative comparison of various reconstruction methods at different levels of incident x-ray fluence (I0, with units photons / pixel). All reconstructions used a highly sparse data acquisition of 20 projections over 200° except for the filtered-backprojection case in the top row, which used 360 projections over 360°. Zoomed images of the nodule are shown for each case. The region-of-interest used for local RMSE computation in proximity to the nodule is shown as a white circle in the upper right image.

