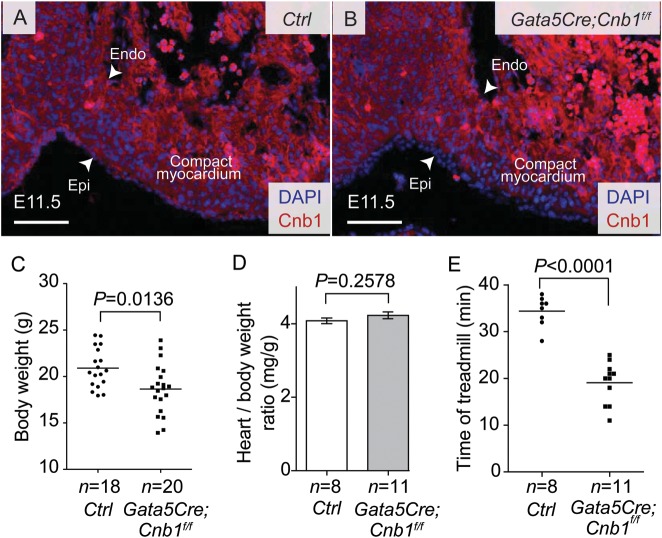
Figure 1.
Gross phenotype of epicardium-restricted Cnb1 mutant mice. (A and B) Immunostaining of Cnb1 in E11.5 hearts of littermate control (A) and Gata5Cre;Cnb1f/f (B) mice. White arrow indicates the epicardial (Epi) and endocardial (Endo) border. Red: Cnb1. Blue: DAPI nuclear staining. Scale bar: 100 μm. (C) Body weight distribution of littermate control and Gata5Cre;Cnb1f/f mice. Data represented are means ± SEM. P-value: Student's t-test. Error bar: SEM, standard error of the mean. Line represents the mean of body weight. (D) Heart ventricle to body-weight ratio of 2-month-old littermate control was comparable with that of the Gata5Cre;Cnb1f/f mice. Data shown are means ± SEM. P-value: Student's t-test. Error bar: SEM, standard error of the mean. (E) Running time on the treadmill of littermates at 2 month of age. Data represented are means ± SEM. P-value: Student's t-test. Error bar: SEM, standard error of the mean.

