Figure 5.
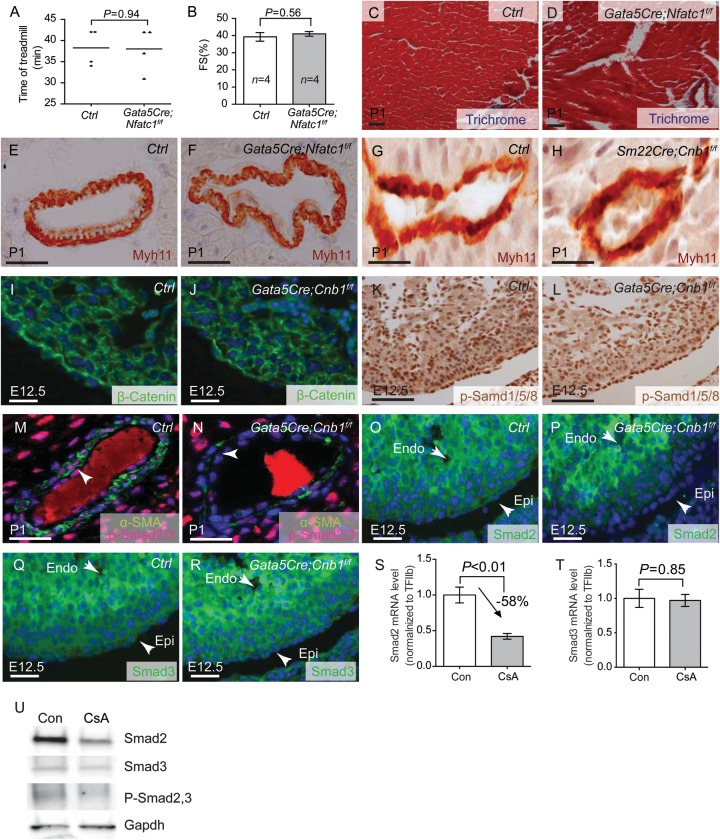
Calcineurin controls TGFβ/Smad2 signalling to regulate coronary SMC development. (A) The exercise treadmill test of 2-month-old littermate control and Gata5Cre;Nfatc1f/f mice. Data shown are means ± SEM. P-value: Student's t-test. Error bar: SEM, standard error of the mean. (B) Echocardiographic measurement of fractional shortening of the left ventricle of 2-month-old littermate control and Gata5Cre;Nfatc1f/f mice. P-value: Student's t-test. Error bar: SEM, standard error of the mean. (C and D) Trichrome staining of fibrosis in 2-month-old littermate control and Gata5Cre;Nfatc1f/f hearts. Red: cardiomyocytes. Blue: fibrosis. Scale bar: 100 μm. (E and F) Immunostaining of Myh11 in P1 heart of littermate control and Gata5Cre;Nfatc1f/f mice. Brown: Myh11. Blue: haematoxylin nuclear staining. Scale bar: 100 μm. (G and H) Immunostaining of Myh11 in P1 heart of littermate control and Sm22aCre;Cnb1f/f mice. Brown: Myh11. Blue: haematoxylin nuclear staining. Scale bar: 100 μm. (I and J) Immunostaining of β-catenin in E12.5 hearts of littermate control and Gata5Cre;Cnb1f/f mice. Green: β-catenin immunostaining. Blue: DAPI nuclear staining. Scale bar: 100 μm. (K and L) Immunostaining of p-Smad1/5/8 in E12.5 hearts of littermate control and Gata5Cre;Cnb1f/f mice. Brown: p-Smad1/5/8 staining. Blue: haematoxylin nuclear staining. Scale bar: 100 μm. (M and N) Co-immunostaining of α-SMA and p-Smad2/3 in P1 hearts of littermate control and Gata5Cre;Cnb1f/f mice. Green: α-SMA staining, Red: p-Smad2/3 staining. Blue: DAPI nuclear staining. Scale bar: 100 μm. Arrow indicates the coronary artery smooth muscle layer. (O–R) Immunostaining of Smad2 and Smad3 in E12.5 hearts of littermate control and Gata5Cre;Cnb1f/f mice. Green: Smad2, Smad3 immunostaining. Scale bar: 100 μm. Blue: DAPI nuclear staining. (S and T) Quantitation of Smad2, Smad3 mRNA in control or CsA-treated (500 ng/mL) rat EMC cells. n = 5. Data shown are means ± SEM. P-value: Student's t-test. Error bar: SEM, standard error of the mean. (U) Western blot analysis of Smad2, Smad3 and pSmad2/3 in control or CsA-treated (500 ng/mL) rat EMC cells.

